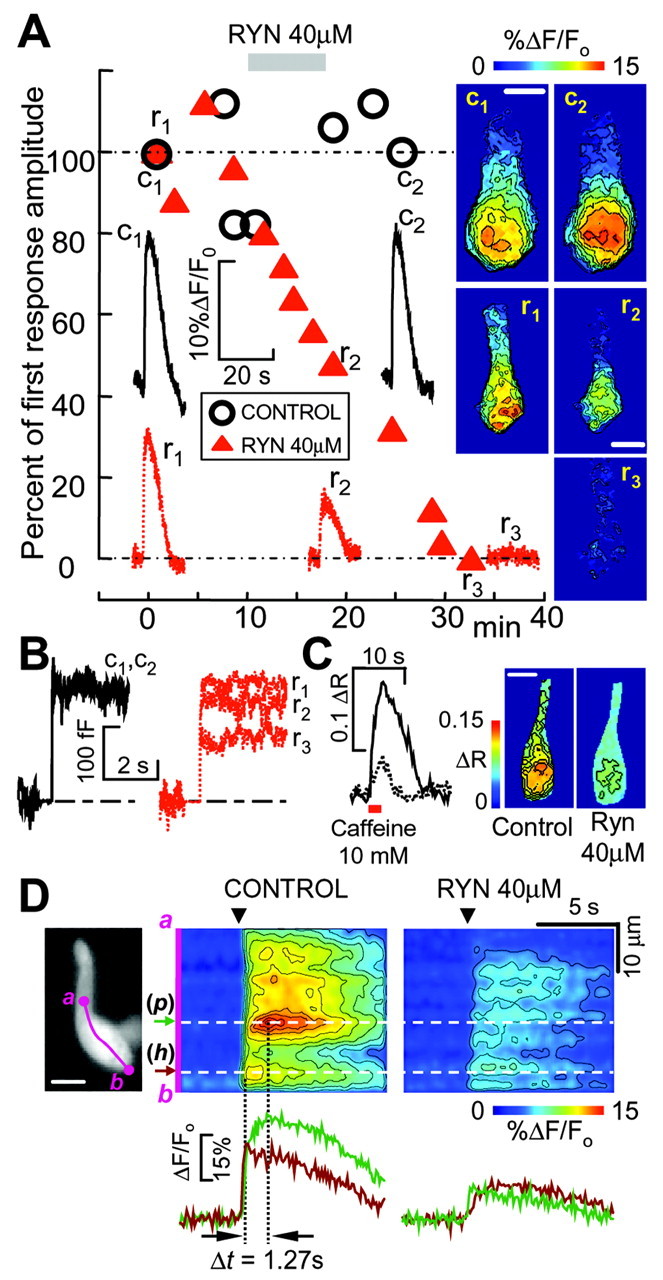
Figure 4.

Effect of ryanodine on Ca2+ signals and exocytosis. A, Time course of ryanodine (RYN) effects on Ca2+ responses evoked by 500 msec depolarizations to -20 mV measured from isolated hair cells in perforated-patch conditions; holding potential, -80 mV. In control experiments (open circles), responses were usually stable for at least 25 min. The application of 40 μm ryanodine (RYN) for 8 min (gray bar) caused a steady and irreversible decline of Ca2+ responses (filled triangles, different cell). Symbols represent peak Ca2+ responses averaged over a 64 μm2 ROI superimposed on the cell synaptic pole, normalized to the first recording. Representative sample traces corresponding to labeled symbols are shown (c1 and c2, control; r1, r2, and r3, ryanodine), together with corresponding ΔF/Fo cell images recorded at response peak times and color coded to highlight Ca2+-dependent fluorescence changes relative to prestimulus conditions (as in Fig. 2 A). B, Effects of ryanodine on cell capacitance: same cells, stimulation protocols, trace labels, and line styles as in A. In control experiments (left), ΔCm recordings were stable for at least 25 min (overlapping traces c1 and c2), whereas 40 μm ryanodine (right) decreased ΔCm (traces r1, r2, and r3), although less markedly than the corresponding Ca2+ responses in A. C, Effect of transient caffeine application (10 mM, 2.5 sec, red bar) on a hair cell in a whole crista slice loaded with fura-2 AM, before (solid line and left image) and after a 6 min incubation with 40 μm ryanodine (dotted line and right image). Responses are given as uncalibrated 360/380 nm fura-2 ratio changes ΔR = R - Ro, where Ro is prestimulus ratio (see Materials and Methods). Traces represent the time course of pixel spatial averages computed over the whole synaptic pole. D, Ryanodine affects Ca2+ responses differently in different subcellular regions. D, left, Hair cell loaded with the AM ester of Oregon Green under perforated patch recording conditions (scale bar, 10 μm); the tip of the patch pipette, entering from the right, hosts an internally sealed ω-shaped fraction of the plasma membrane and related fluorescent cytoplasm. D, middle, In control conditions, 500 msec depolarization to -20 mV (arrowhead) evoked an immediate Ca2+ response at (h), near the bottom of the cell, whereas the larger responses at (p) displayed an additional slower phase, peaking 1.27 sec later. D, right, Perfusion of ryanodine 40 μm depressed Ca2+ responses throughout the cell, but relatively more at (p), which is hence functionally identified as a preferential site for CICR, consistent with the results illustrated in Figures 2 and 3.
