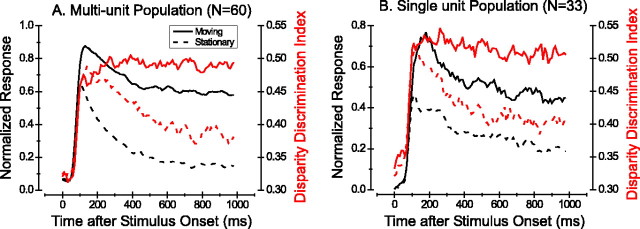
Figure 10.
Population summary of response and disparity tuning dynamics. A, Population response (to the preferred disparity) and DDI as a function of time for the 60 of 76 multiunits with significant disparity tuning (ANOVA; p < 0.05). Data are in the same format as Figure 9C, except that the response curves for each unit were normalized (to a peak of 1.0) before averaging. DDI curves were simply averaged across units. B, Response and DDI as a function of time for the population of (33 of 42) MT single units with significant disparity tuning for both moving and stationary stimuli.

