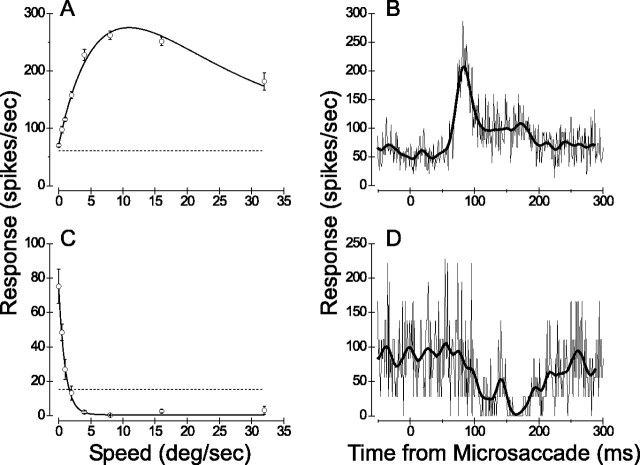
Figure 12.
Examples of saccade-triggered averages. A, Speed tuning curve for an MT multiunit that preferred moderately fast speeds. Format is as in Figure 2A. B, Saccade-triggered average for the same MT multiunit. The thin curve is the raw saccade-triggered spike average. The thick curve is the same data after smoothing with a Gaussian kernel with SD of 6 msec. Note the clear peak after microsaccades. C, Speed tuning curve for an MT single unit that responded optimally to stationary dots and gave no response to movement faster than 2 deg/sec. D, Saccade-triggered average for this single unit shows a clear suppression of response after microsaccades.

