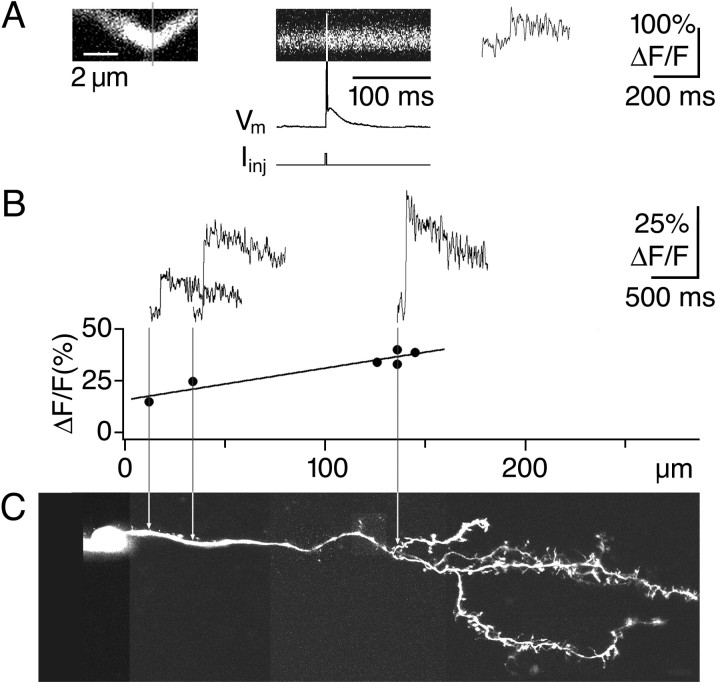
Figure 1.
Action potentials produce calcium transients in granule cell dendrites. A, Experimental design. The left panel shows a dendrite of the cell in C, with the line scan position indicated by the gray vertical line. The middle panel shows the line scan across the dendrite (top), the voltage trace of the corresponding action potential (middle; white/black) evoked by current injection (bottom) to the granule cell soma. The right panel shows the fluorescence transient resulting from this line scan. B, (ΔF/F)AP amplitudes do not decrease with distance from the soma. The top traces represent averaged calcium transients imaged at increasing distance from the soma in the cell shown in C. The bottom graph shows dendritic (ΔF/F)AP amplitudes versus distance from the soma and their linear fit. C, Scan of the corresponding granule cell at the same scale. Arrows indicate the measurement locations.

