
Figure 3.
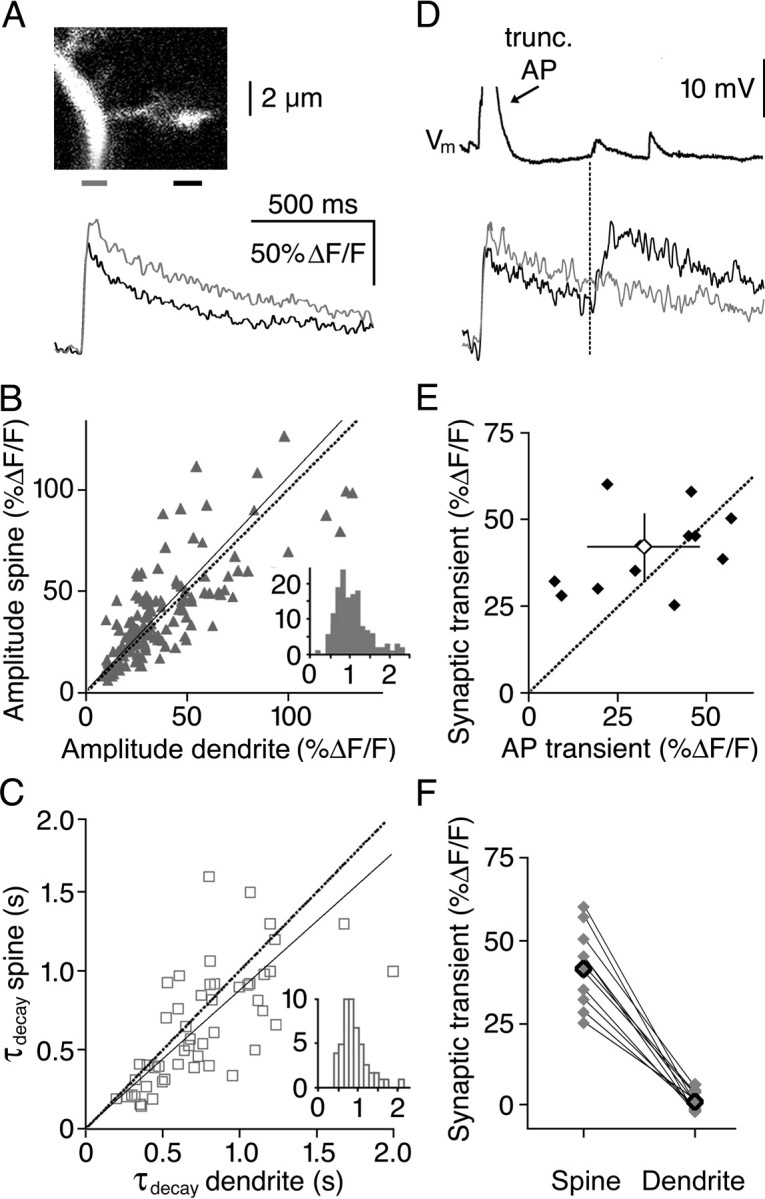
AP and synaptically mediated calcium transients are observed in spines. A, Spine and dendritic (ΔF/F)AP transients are similar. The scan shows a large spine/gemmule, located at 111 μm from the cell soma. Below, the averaged filtered transients in dendrite (gray) and spine (black) are shown, as measured in the regions with respective colors indicated below the scan. The horizontal line scan was aligned with the spine. B, Similar (ΔF/F)AP amplitudes are observed in dendrites and spines. The scatterplot shows transient amplitudes in spines versus transient amplitudes in the adjacent dendrite. The dotted line represents the diagonal x = y, and the straight line a linear fit to the data. The inset shows a histogram of amplitude ratios spine/dendrite. C, Slightly faster (ΔF/F)AP decay is seen in spines than in dendrites. The scatterplot shows transient decay constants in spines versus transient decay time constants in the adjacent dendrite, with details similar to B. D, Spontaneous synaptic events occur. The synaptic transient shown was measured in the spine from A, with identical scaling. The top trace shows the voltage recording with truncated evoked AP and spontaneous EPSPs. The bottom shows corresponding calcium signals in the spine (black) and adjacent dendrite (gray). Note that the AP evokes a transient both in spine and dendrite, whereas the spontaneous transient is localized to the spine and coincides with a spontaneous EPSP. E, Synaptic and AP-evoked ΔF/F amplitudes are similar. The scatterplot shows mean synaptic versus AP-evoked ΔF/F amplitudes in each spine where spontaneous synaptic events were observed (n = 12). The open diamond represents the population mean ± SD. F, Synaptic calcium is not observed in the adjacent dendrite. The plot shows mean synaptic ΔF/F amplitudes in all spine/dendrite pairs where spontaneous synaptic events were observed (n = 12). Mean values are represented by open diamonds.