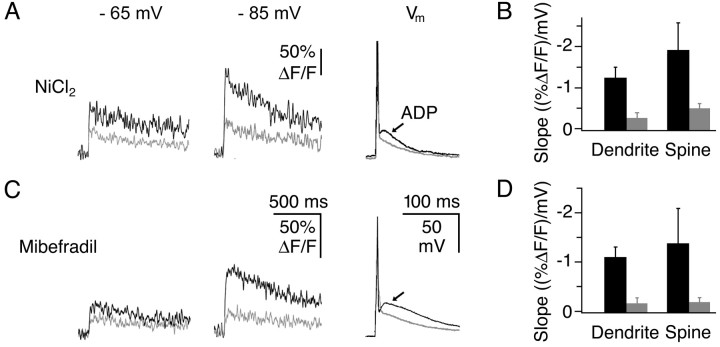
Figure 5.
T-type calcium channels underlie voltage dependence of calcium transients. Black traces represent control data and gray traces data with drug applied (100 μm NiCl2, 1-10 μm mibefradil). A, B, NiCl2 reduces (ΔF/F)AP amplitude voltage dependence and blocks the ADP. C, D, Mibefradil also reduces (ΔF/F)AP amplitude voltage dependence and blocks the ADP. The three panels in A and C show individual experiments. The traces were recorded at prespike potentials of -65 and -85 mV, respectively, and the AP at -70 mV. B and D show the average linear slope of voltage dependence (see Materials and Methods) in dendrites and spines before and after drug application (error bars indicate SEM; NiCl2: n = 9 dendrites, n = 3 spines; mibefradil: n = 9 dendrites, n = 5 spines).

