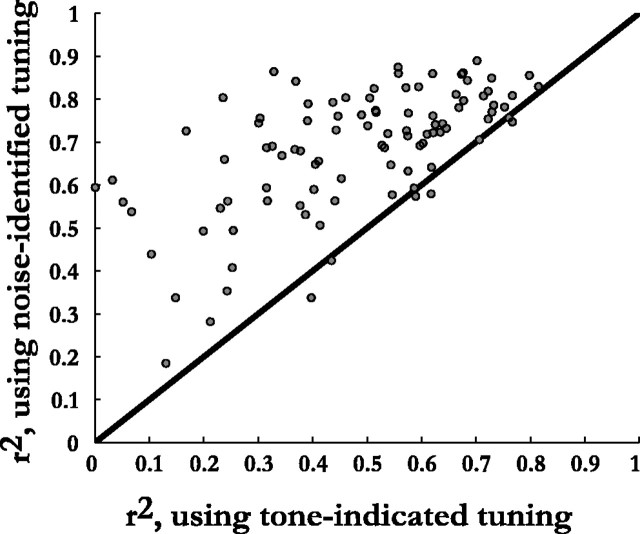
Figure 3.
Proportion of variance, r2, in the measured ILD-alone response surfaces explained by frequency-specific ILD tuning inferred from broadband responses compared with r2 values obtained from tuning measured with tones. The bootstrapping procedure used to infer the tuning from broadband responses was based on 30% of the locations picked at random, with replacement, and averaged over 20 repetitions.

