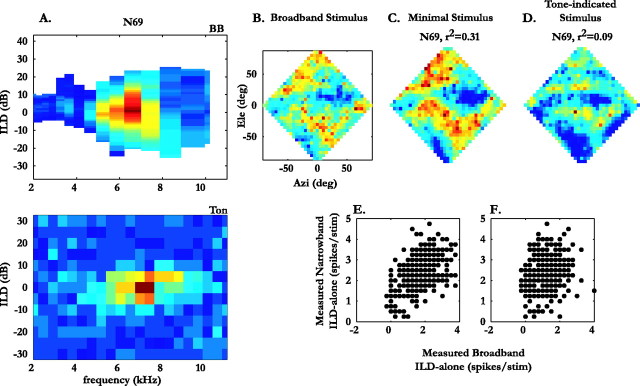
Figure 7.
Contribution of frequency bands identified by tonal and broadband stimuli, shown for neuron N69.A, Tuning for ILD and frequency obtained with broadband stimuli (BB; top) and tonal stimuli (Ton; bottom). B, ILD-alone response surface measured with broadband stimuli. C, ILD-alone surface measured using the minimal stimulus (see Materials and Methods for details). D, ILD-alone surface measured using a tone-indicated stimulus (see Materials and Methods for details). E, Firing elicited at each location by the minimal stimulus plotted against the firing at each corresponding location in the ILD alone surface obtained with the broadband stimulus (B). F, Firing elicited at each location by the tone-indicated stimulus plotted against the firing at each corresponding location in the ILD-alone surface obtained with the broadband stimulus (B). The variances, r2, obtained from the scatter plots in E and F are shown above the ILD-alone surfaces in C and D, respectively.

