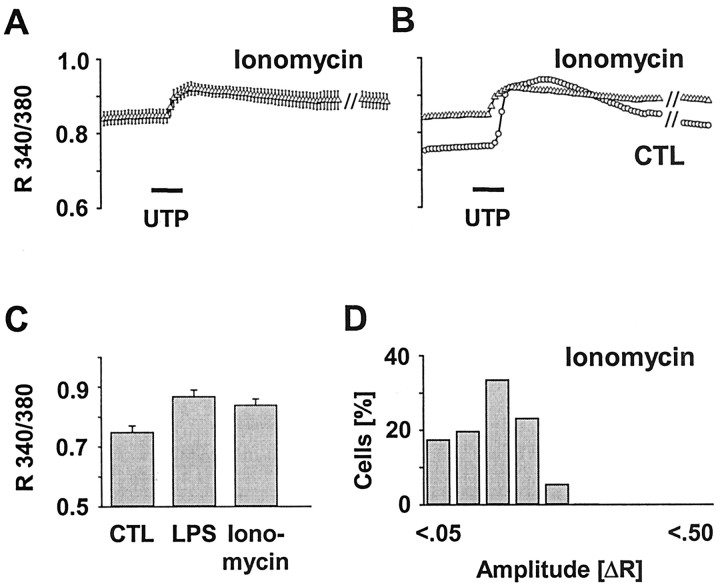
Figure 4.
Influence of an ionophore-induced elevation of the basal [Ca 2+]i on UTP-evoked Ca 2+ signals. Microglial cultures were incubated with ionomycin (1 μm, 24 hr), and [Ca 2+]i was measured as R 340/380. Calcium transients were elicited by stimulation with UTP (100 μm, 30 sec). A, Average [Ca 2+]i trace in ionomycin-treated cells calculated from six independent experiments with a total of n = 515. Data are given as mean ± SEM. B, Overlay of the average traces of ionomycin-treated and control (CTL) microglia (Fig. 1C) showing an elevated [Ca 2+]i together with a reduced amplitude of the receptor-evoked [Ca 2+]i transient. C, Quantification of the basal [Ca 2+]i of ionomycin-treated microglia compared with the LPS and control groups (Fig. 1 F). D, Histogram of UTP-evoked [Ca 2+]i signal amplitudes (ΔR) in cells after ionomycin treatment (as in A). Amplitudes were calculated and classified as described in Figure 1. The histogram indicates a shift of the ΔR to smaller values as similarly obtained from LPS-activated cells (Fig. 1 H).

