
Figure 9.
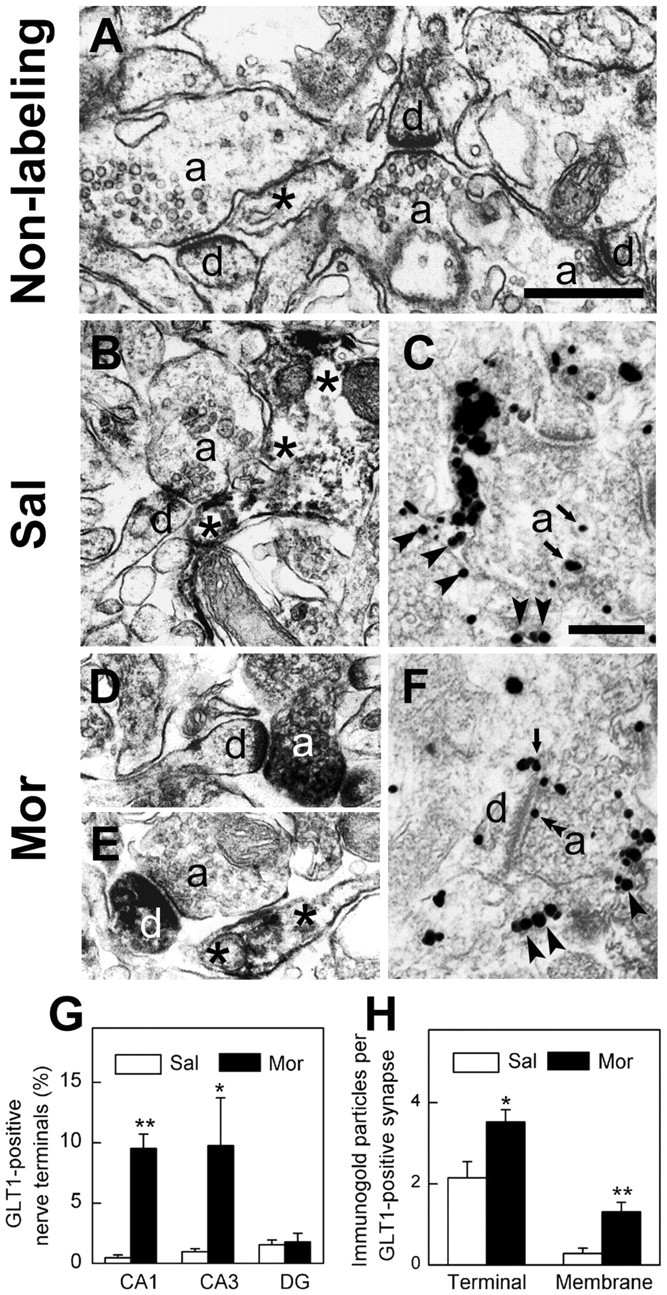
Translocation and surface expression of GLT1 at hippocampal nerve terminals after morphine withdrawal as revealed by electron microscopy. The morphological results of the CA3 region of the hippocampus were presented as representatives in A–F. A, The ultrastructure without immunolabeling of hippocampal CA3 regions, in which synapses were formed by axonal terminals (a) and dendrites (d). A process of astrocyte was indicated with an asterisk. B, A GLT1-positive astrocyte (asterisks) was present to be juxtaposed to a synapse in the CA3 region of the saline group.C, Anaxonal terminal (a) containing gold–silver particles for GLT1 labeling was seen adjacent to a GLT1-positive astrocyte process (arrowheads) in the saline group. The gold–silver particles (arrows) in the axonal terminal were in the cytoplasm.D, AGLT1-positive axonal terminal(a) made synaptic contact with an unlabeled dendrite(d) in the morphine-treated group.E, Near a GLT1-positive as trocyte(asterisks), an unlabeled axonal terminal (a) formed a synapse with a GLT1-positive dendrite (d) in the morphinetreated group. F, A hippocampal axonal terminal (a) containing GLT1 labeling was shown close to a GLT1-positive astrocyte (arrowheads). Arrow points to gold–silver particle located in the plasma membrane of a dendrite. Double arrowheads point to the labeling in the presynaptic membrane. Scalebars:(inA) A,B,D,E, 1 μm; (in C) C,F, 0.5 μm. G, Quantitative analysis showed that the number of GLT1-positive nerve terminals was increased in both CA1 and CA3 region but not in DG region. The data were pooled from three sections of different rats in each group. The total numbers of terminals counted in CA1, CA3, and DG regions: 496, 519, and 381 in the saline group; 428, 494, and 326 in the morphine group. H, The number of gold–silver particles in nerve terminals that form synapses (Terminal) as well as associated with the plasma membrane per GLT1-positive synapse(Membrane) were quantified in the saline (n=28) and morphine-treated (n=110) groups, respectively. Both particle numbers were significantly increased in the morphine-treated group compared with the control group. *p < 0.05 and **p < 0.01 compared with the saline group. Sal, Saline treatment; Mor, morphine treatment.