Figure 5.
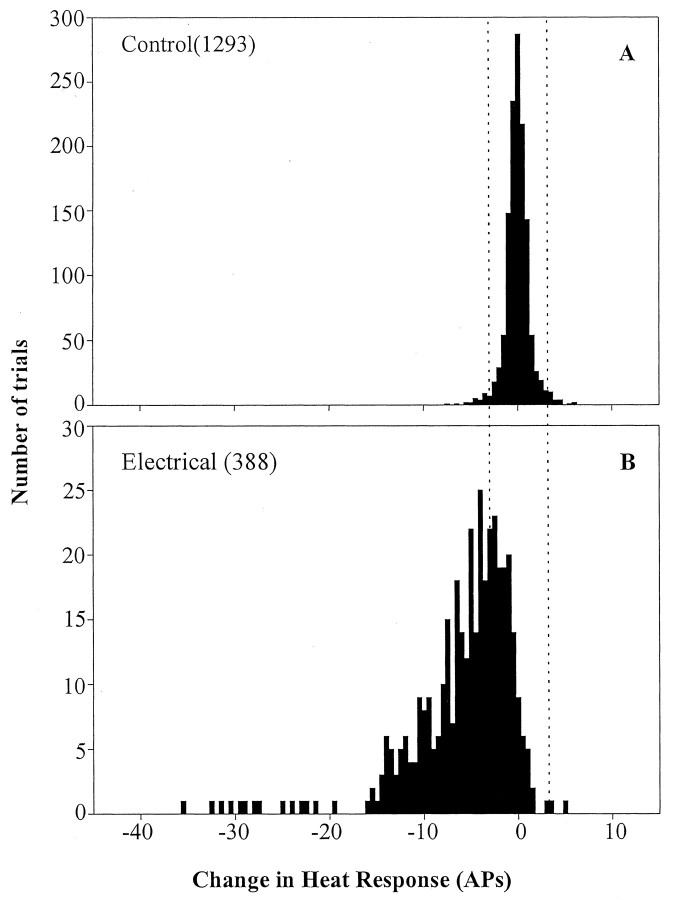
Variability of test-heat evoked response. A, To establish the variability in heat response without a CS, a control data point was determined for each CS. The change in response during the three test stimuli before the CS was computed [C - (A + B)/2; see Fig. 1 for nomenclature]. In the absence of a CS, the distribution had a mean of zero and an SD of 1 action potential. A significant change after a CS was defined as any change that was greater than three SDs from the mean (i.e., ±3 action potentials) of the control data. This criterion is illustrated by the dotted vertical lines. B, Variability of heat response after the electrical CS. The response to the test stimulus after the CS was subtracted from the average response to the two test stimuli before the CS [D - (B + C)/2; Fig. 1]. Response fatigue was common and manifest by a shift to the left of the distribution. APs, action potentials.

