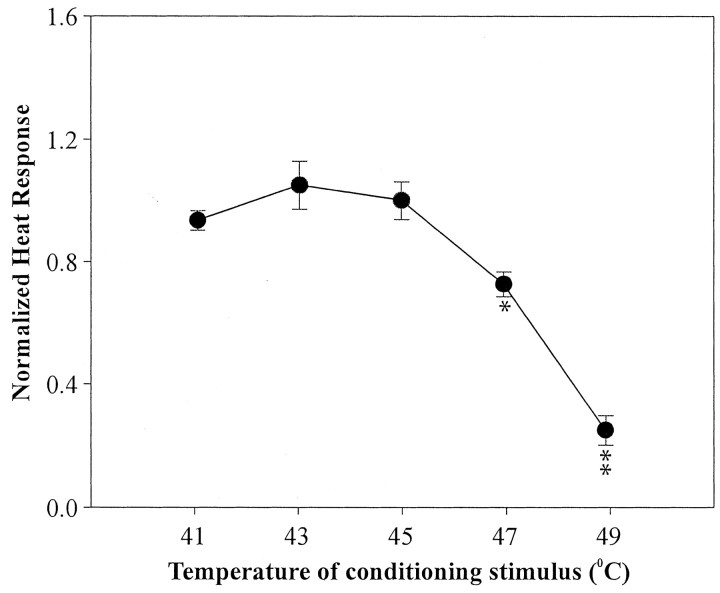
Figure 8.
Fatigue after a heat CS. The normalized response to the test-heat stimulus is plotted as a function of the temperature of the heat CS. Fatigue increased as the temperature (hence evoked response) of the CS increased. (*p < 0.05 and **p < 0.001 compared with response for lower CS temperatures)

