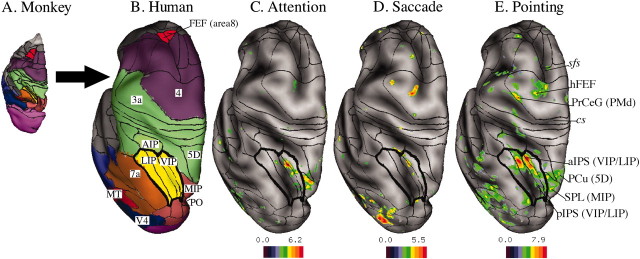
Figure 3.
A, Macaque brain with anatomical areas (Lewis and Van Essen, 2000). B, Deformation and mapping of macaque areas onto a human atlas brain (left hemispheres, dorsal views) using surface-based registration. Red indicates the FEF (area8), purple indicates motor areas (area4), green indicates somatosensory areas (AIP, areas 5D and 3A), and yellow indicates visual parietal areas (LIP, VIP); the lines in each area define the LIP (dorsal and ventral) within the lateral intraparietal complex and VIP subdivisions (medial and lateral) within the ventral intraparietal area. Brown indicates other parietal areas (area 7A, PO), dark red indicates the MT, and blue indicates V4. C, Group-average ANOVA F(z) map, averaged over cue direction for attention. Black borders indicate deformed macaque visual areas painted in Figure 4 A. D, F(z) map during saccade preparation. E, F(z) map during pointing preparation. Labels in italic indicate the anatomical landmarks. Abbreviations include anatomical locations in the human brain and a deformed area in the monkey (in parentheses): sfs, Superior frontal sulcus; cs, central sulcus; PrCeG, precentral gyrus; PMd, premotor dorsal. Data sets are available at http://pulvinar.wustl.edu:8081/sums/archivelist.do?archive_id=315115.

