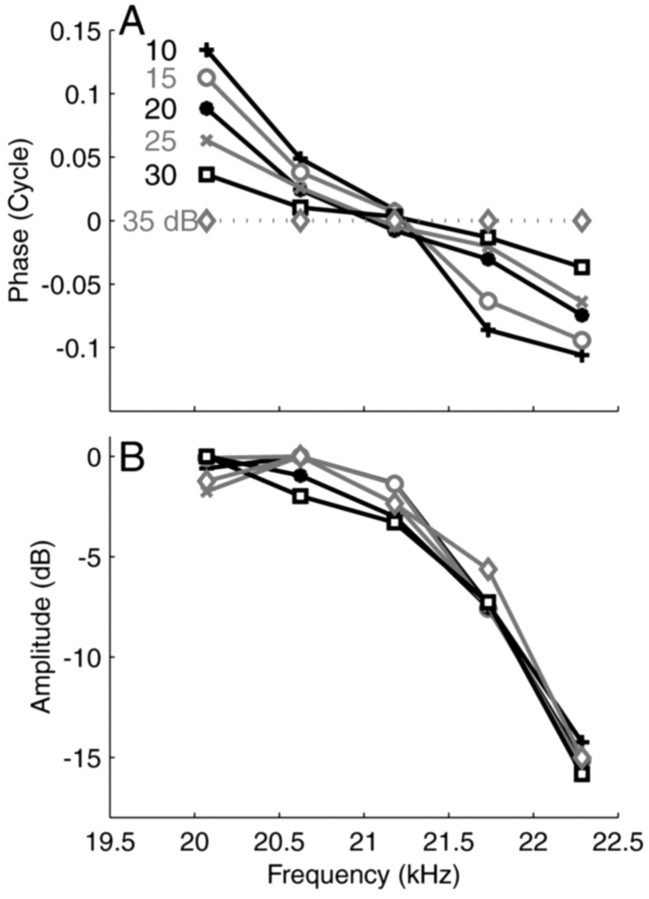
Figure 2.
Phase and amplitude curves of a high-CF fiber (20.6 kHz; SR, 57 spikes/sec; driven rates between 82 and 130 spikes/sec) obtained at stimulus levels varying from 10 to 35 dB per primary. A, Phases are plotted as differences relative to the 35 dB reference condition. The vertical offset of the curves is arbitrary. B, Amplitude curves.

