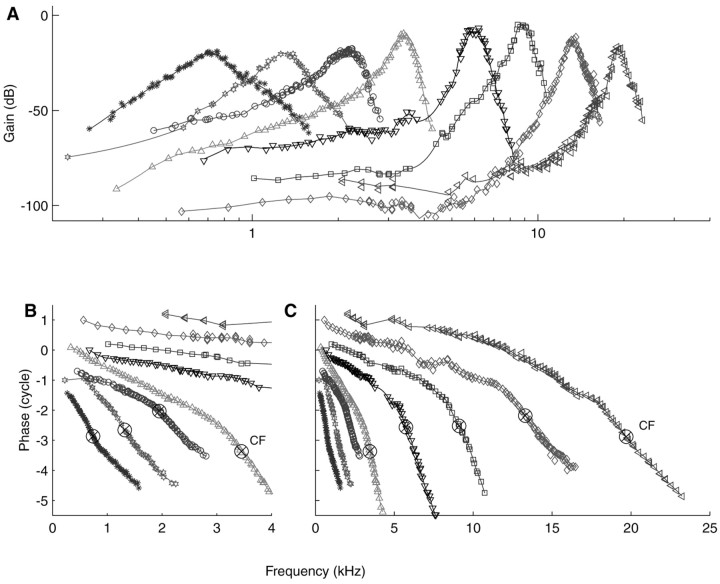
Figure 4.
Family of composite curves from a single AN of a cat. A, Amplitude curves. CFs range from 740 Hz to 19.7 kHz. Individual curves have been vertically offset according to the respective thresholds of the fibers. B, Blow-up of the low-frequency portions of the phase curves. The ⊗ indicates the CFs of the fibers. Note the transition from a concave shape to a convex shape with increasing CF. C, Entire phase curves, advanced by 1 msec. Relative vertical positions were adjusted to avoid overlap.

