
Figure 1.
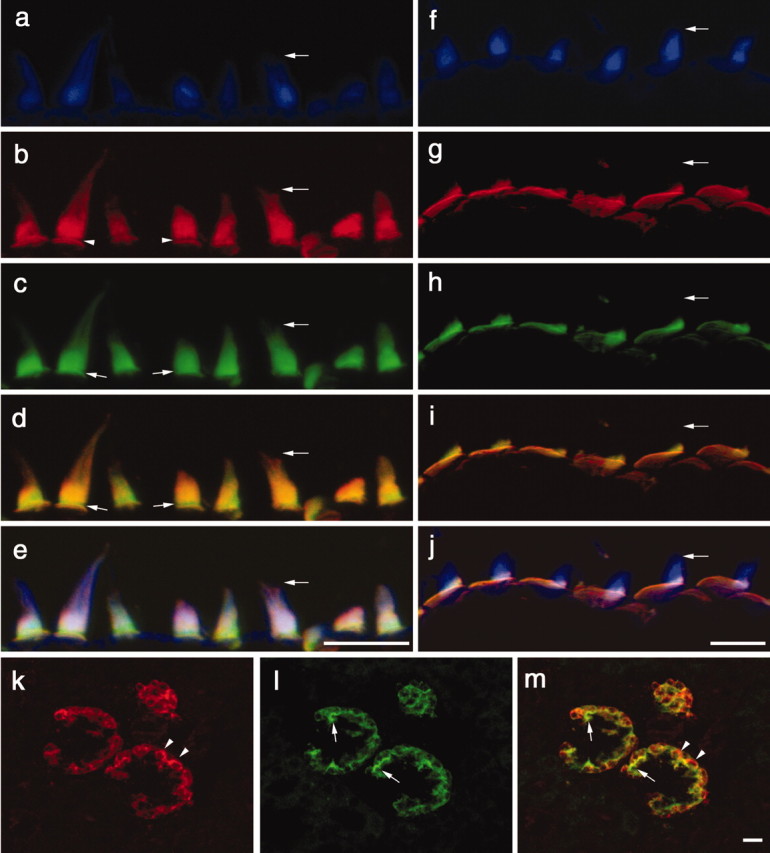
Distribution of anti-HCA and anti-Ptprq immunostaining in the inner ear and kidney of the early posthatch chick. a-j, Compressed z-stacks of confocal sections from the extrastriolar region of the utricular macula (a-e) and the basilar papilla (f-j), triple-labeled with Alexa 350 phalloidin (a, f), polyclonal anti-Ptprq (b, g), and monoclonal anti-HCA mAb (c, h). d, i, Merges of anti-Ptprq and anti-HCA mAb staining; e, j, merges of the images obtained through all three channels (anti-Ptprq, anti-HCA mAb, and F-actin). Horizontal arrows point to the tip of the same hair bundle in a-e and f-j. b, Arrowheads indicate the ankle-link region that is not stained by anti-Ptprq. c, d, Small arrows indicate that anti-HCA mAb staining is present in the ankle-link region. b-d, In the extrastriolar region of the macula, the hair bundle is stained to its distal tip by anti-Ptprq and the anti-HCA mAb. g-i, In the basilar papilla, staining with both antibodies is restricted to the proximal end of the hair bundle. g, h, The extensive, nonstereociliary apical membrane of the hair cell is clearly stained by both antibodies in the basilar papilla. k, l, Compressed z-stacks of confocal section from the chick kidney double labeled with anti-Ptprq (k) and the anti-HCA mAb (l). m, Merge of anti-Ptprq and anti-HCA mAb staining. Arrowheads indicate areas that stain only with anti-Ptprq; arrows indicate areas that stain only with the anti-HCA mAb. Scale bars, 10 μm.