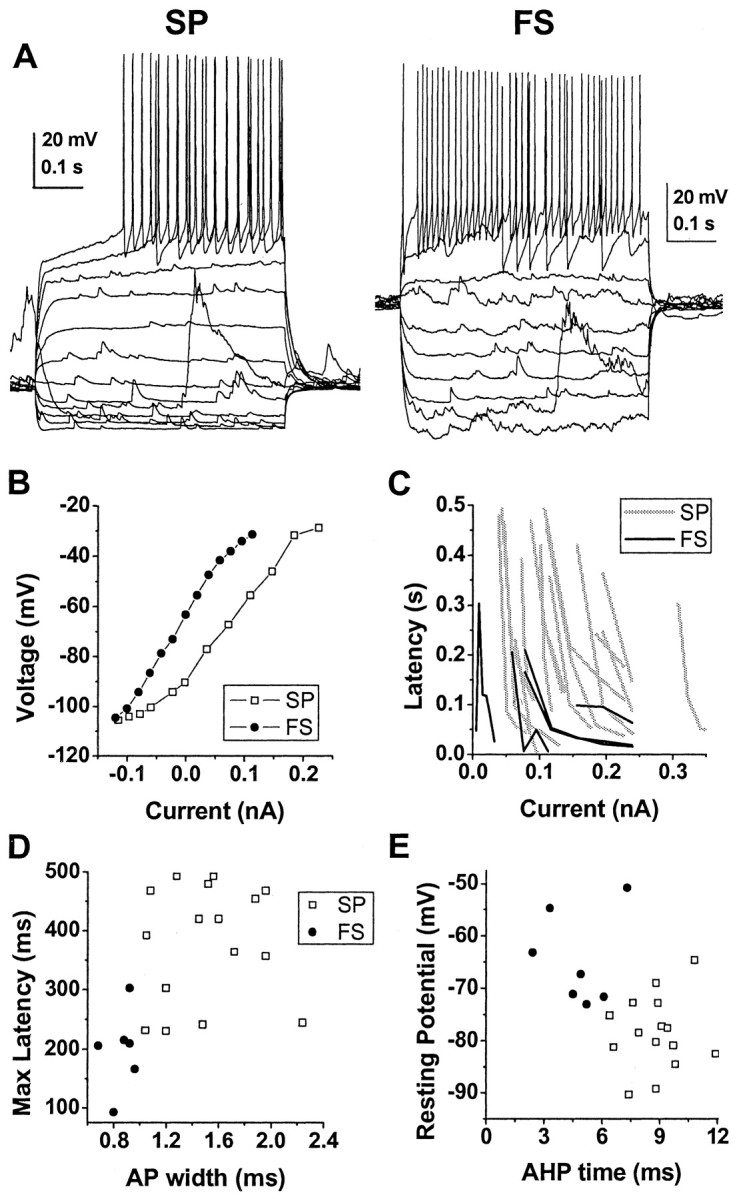
Figure 2.

Differences in electrophysiological characteristics of spiny projection neurons (SP) and fast spiking interneurons (FS) recorded with whole-cell patch pipettes in current clamp. A, Responses of an SP and an FS to somatic current-pulse injections. B, Steady-state current-voltage plot for SP and FS. C, Latency to first action potential as a function of current injection for each neuron. Note the increased latency for SP (gray lines) compared with FS (black lines) independent of current strength. D, Scatter plot of maximum observed latency to first action potential versus action potential (AP) width. E, Scatter plot of down-state membrane potential versus time to maximal spike afterhyperpolarization (AHP). Note that spiny projection neurons and fast spiking interneurons form separate clusters in both of these two-dimensional parameter spaces.
