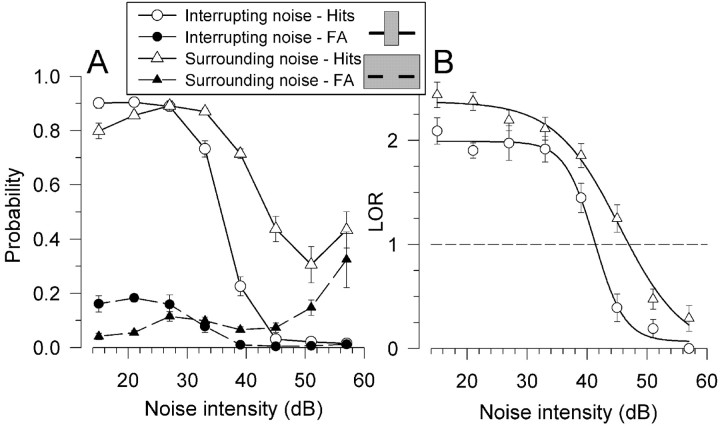
Figure 3.
Psychometric functions and threshold determination. Plots show representative noise-intensity experiment psychometric functions from subject X for interrupting (circles) and surrounding (triangles) noise. Spectrograms of target stimuli are schematized in the legend. A shows the probability of a hit (solid lines and open symbols) or false alarm (FA) (dashed lines and black-filled symbols) for interrupting and surrounding noise. B shows the transformation to a criterion-free measure LOR. Curved lines represent sigmoidal functions (Eq. 2) fit to the points. The dashed line corresponds to the threshold level of LOR = 1. Error bars (SEM) designate the between-session variance in performance.

