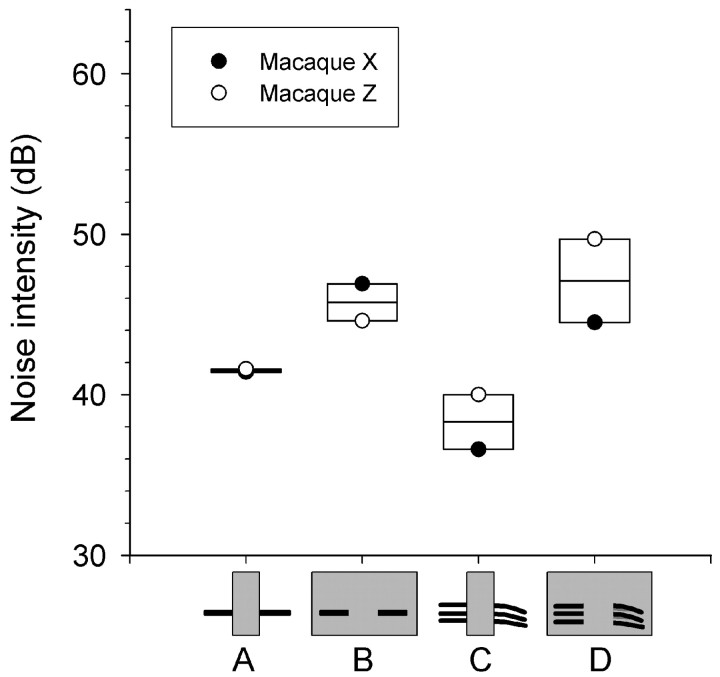
Figure 4.
Box plots of the thresholds of two macaques on the intensity experiment. Noise intensity thresholds for interrupting and surrounding noise are shown using 2 kHz tonal (A, B) and coo vocalization (C, D) foregrounds. Spectrograms on bottom schematize the target stimuli. Shaded circles represent macaque X and open circles represent Z; horizontal lines bisecting the rectangles represent the mean.

