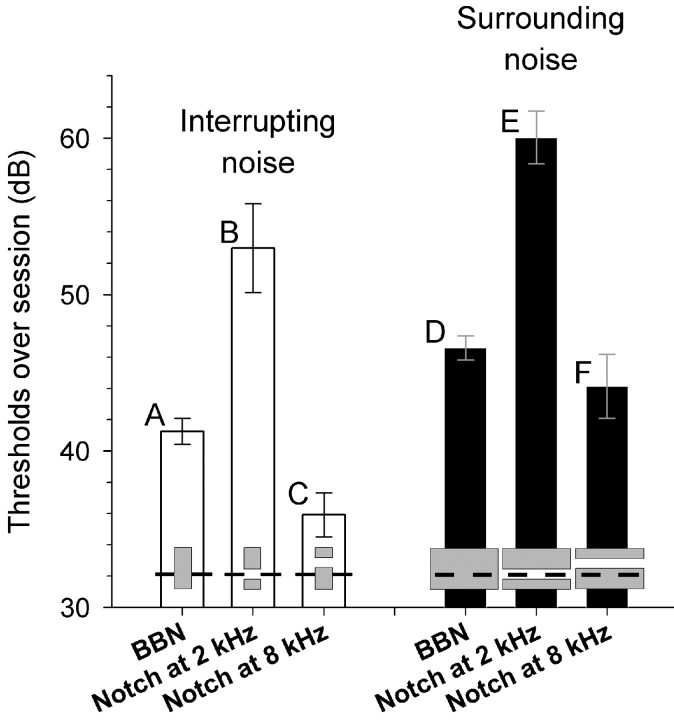
Figure 5.
Intensity experiment thresholds (over session) using notched-noise with 2 kHz tonal foregrounds (subject X only). White bars depict interrupting noise results; black bars depict surrounding noise results. Schematized spectrograms embedded in the bars show the type of noise used—broadband noise (BBN), BBN with a Notch at 2 or 8 kHz—relative to target tones. Error bars designate SE of the mean between sessions.

