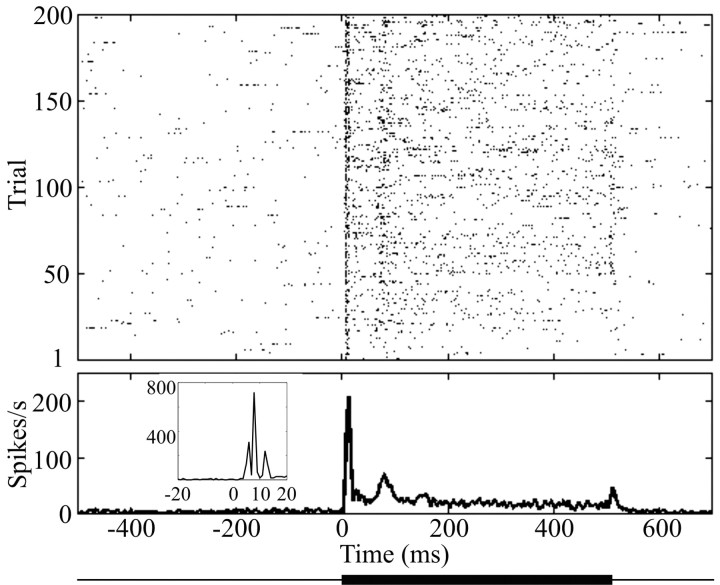
Figure 3.
Responses to a sinusoidal stimulus recorded from a neural cluster. Raster plot and PSTHs from a neural cluster in barrel column B2 recorded in experiment 1. Stimulus was 211 Hz, 87 μm; stimulus 5 in Figure 2a-c. Dots in the top part show spike times across 200 trials, and the corresponding PSTH (bin size, 4 msec) is aligned below the raster plot. Stimulus presentation was from 0 to 500 msec, as indicated by the thick line below the PSTH. The inset shows the earliest portion of the PSTH with 1 msec bins. The three-peaked structure at response onset did not depend on stimulus parameters.

