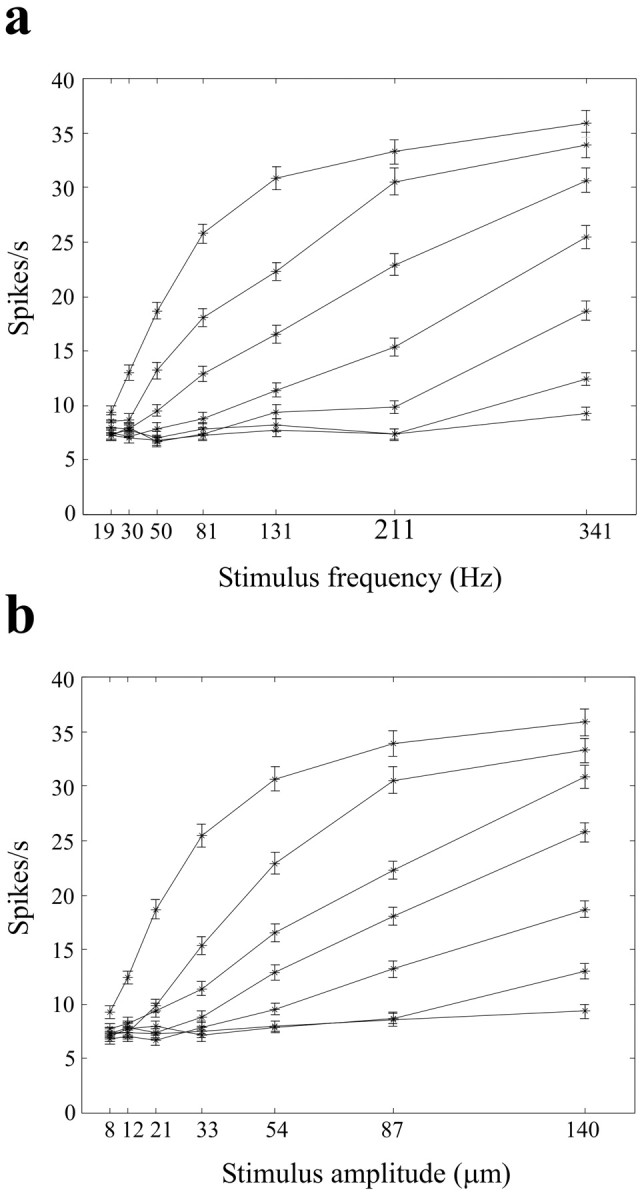
Figure 4.

Frequency and amplitude dependence of firing rates for a neural cluster. Data are from barrel column D2 in experiment 1. Spikes were counted over the 0-500 msec time window (vibration onset, 0 msec) and averaged over 200 trials for each stimulus. Error bars are the SEM spike counts across trials. a, Firing rates are shown as a function of stimulus frequency. Each line connects the points generated by increasing vibration frequency with constant vibration amplitude. Amplitudes increase (8, 12, 21, 33, 54, 87, and 140 μm) from the lowest line to the highest. b, Firing rates as a function of stimulus amplitude. Each line connects the points generated by increasing vibration amplitude with constant vibration frequency. Frequencies increase (19, 30, 50, 81, 131, 211, and 341 Hz) from the lowest line to the highest. Note the similar dependence of firing rate on the change in either frequency or the amplitude.
