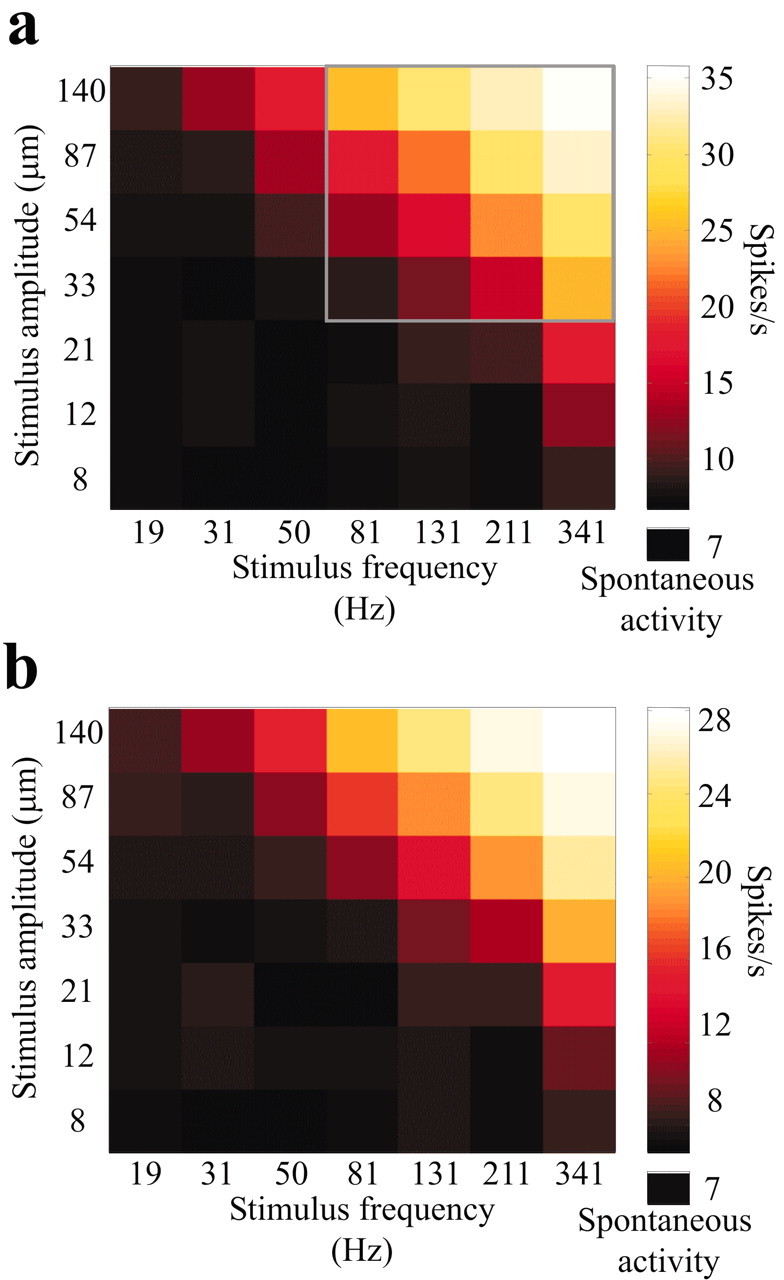
Figure 5.

Neuronal encoding of the vibration feature Af. a, Color plot of spike counts (0-500 msec after stimulus onset) in response to the 7 × 7 stimulus grid for the same neuronal cluster shown in Figure 4. By comparing neuronal responses with the plot of Af (Fig. 2b), it is clear that firing rates were nearly identical within an iso-Af group regardless of the frequency-amplitude combination that gave rise to the stimulus. Firing rates increased as mean vibration speed grew from one iso-Af group to its neighbor. The 4 × 4 set of responses in the frame are analyzed further in Figure 6. The average firing rate in the 500 msec interval preceding stimulus onset is denoted as spontaneous activity, below the color scale. b, Spike counts 100-500 msec after stimulus onset. Even after excluding the early part of the response, the neuronal cluster robustly encoded stimulus Af.
