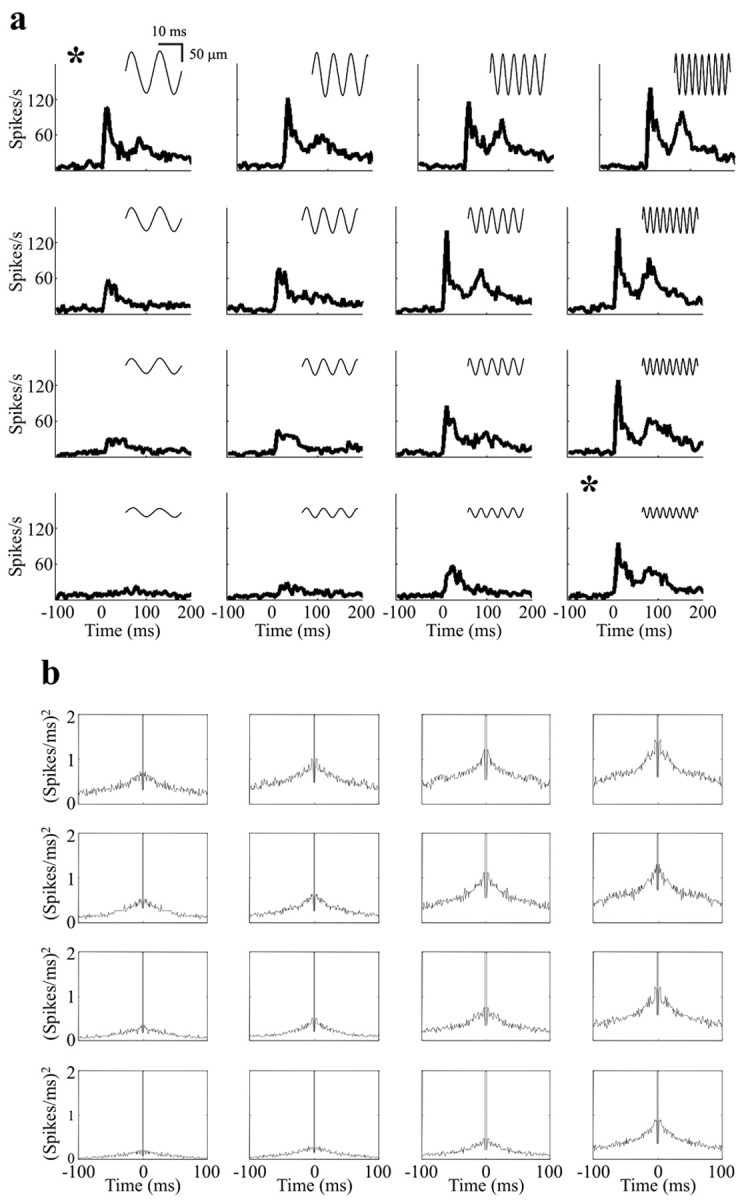
Figure 6.

Temporal structure in responses of a multi-neuron cluster. a, PSTHs corresponding to the 4 × 4 grid in Figure 5. Note the similarity in profiles for the top left and bottom right PSTHs (asterisks), which were generated by stimuli of equal values of the product Af but frequencies of 81 and 341 Hz. b, Autocorrelation histograms (1 msec bin size) for the same 4 × 4 grid. The autocorrelograms were modulated as a function of Af (the number of events simply increased), but for the stimuli of a diagonal iso-Af band there was no temporal structure that could characterize frequency or amplitude.
