
Figure 4.
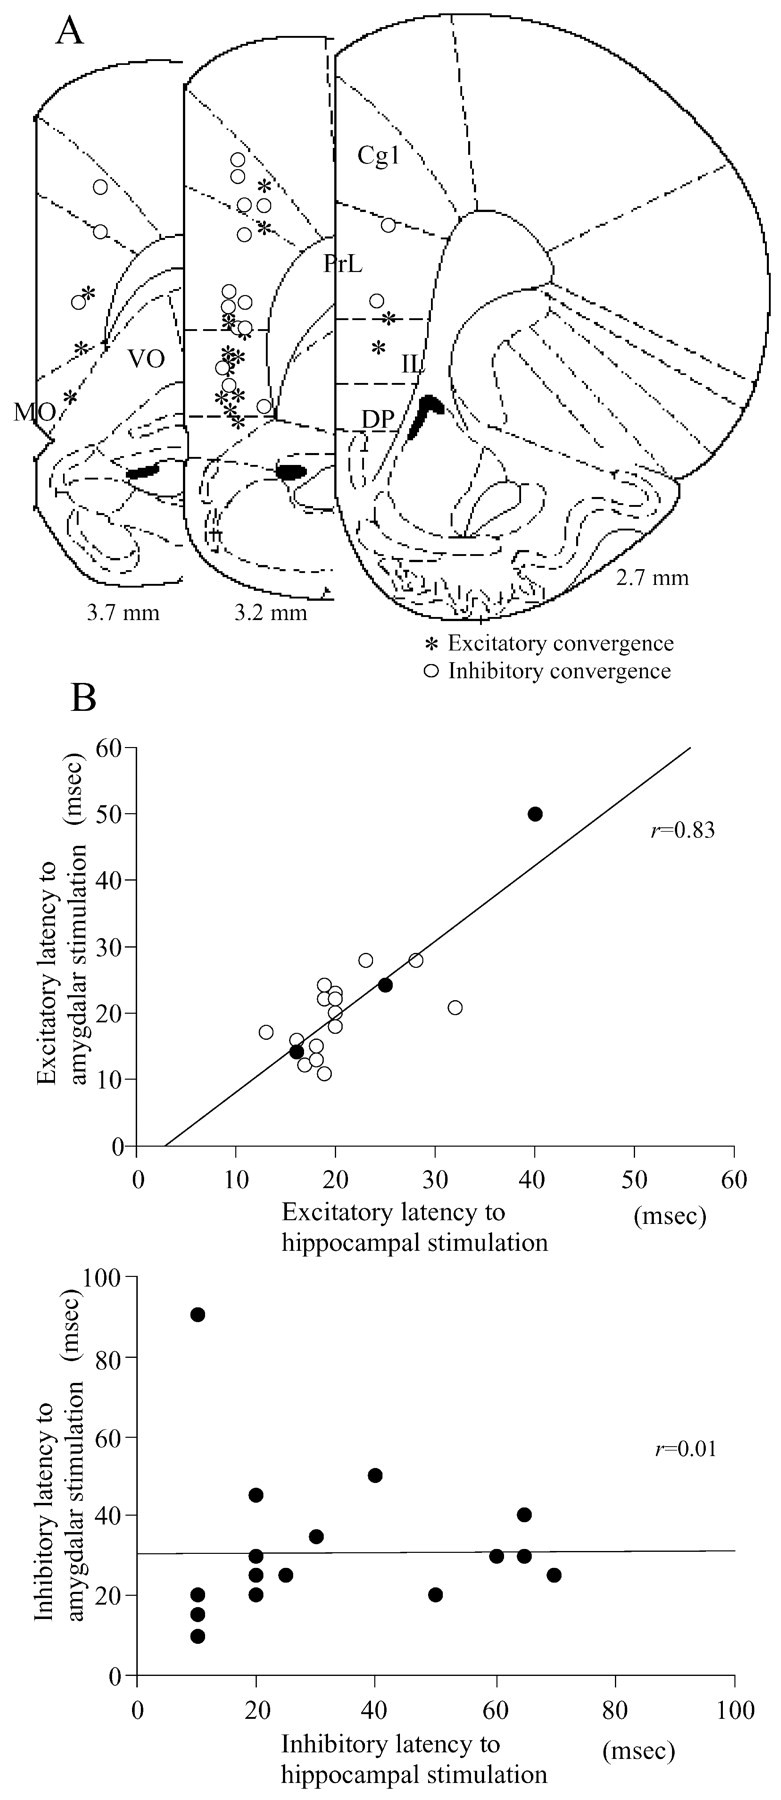
A, B, Distribution of neurons showing excitatory and inhibitory convergences (A) and the correlation of excitatory (B, top) or inhibitory (B, bottom) latencies. Neurons driven by both CA1/S and BLA stimulation were primarily located in the v-PrL and IL. The excitatory but not inhibitory latencies to CA1/S and BLA stimulation revealed a strong positive correlation. A, Asterisk, Neurons driven by both CA1/S and BLA stimulation; ○, neurons that revealed inhibitory responses to both stimulations. B, Top, ○, v-PrL-MO and IL neurons; •, Cg1, d-PrL, and DP neurons.