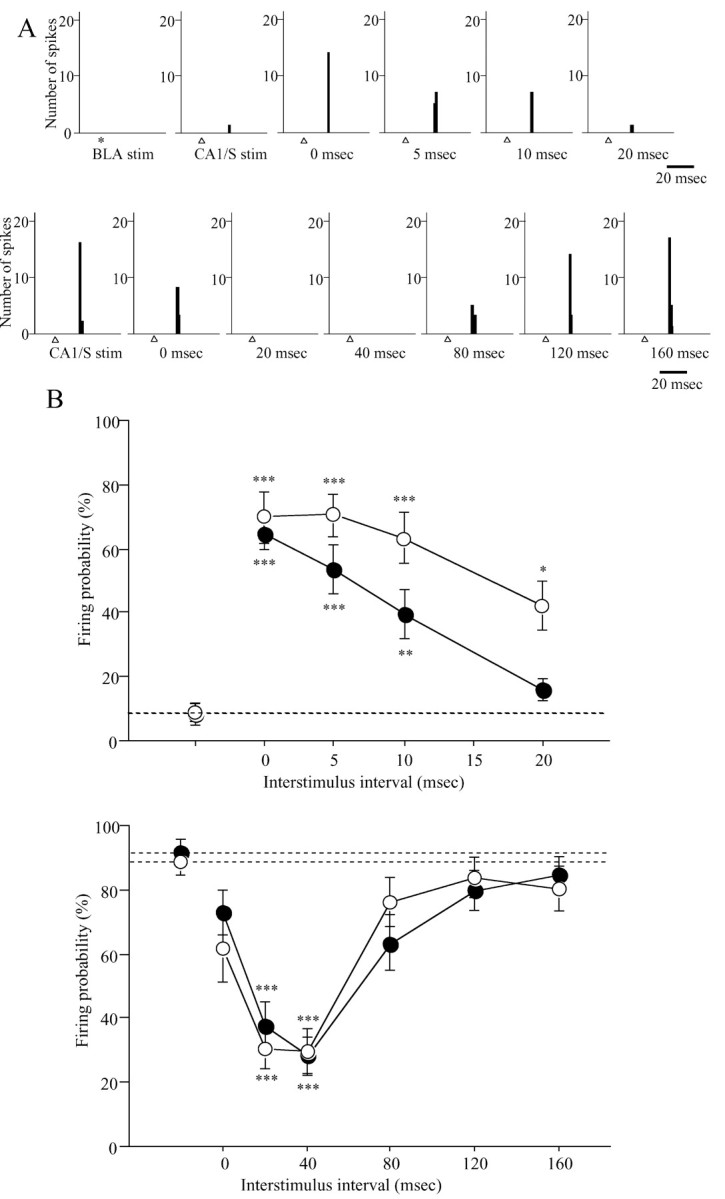
Figure 6.

Examples of OMPFC neurons that revealed facilitation (A, top) and inhibition (A, bottom) of the firing probability of CA1/S-induced excitatory responses after the conditioning stimulation of the BLA and the time course of the facilitatory (B, top) and inhibitory (B, bottom) effects of BLA (or CA1/S) stimulation on excitatory responses to CA1/S (or BLA) stimulation. A, These recordings were obtained in the lesioned rats in which field potentials of the CA1/S (or BLA) evoked by BLA (or CA1/S) stimulation completely disappeared after the lesions. These neurons were located in the IL (A, top) and v-PrL (A, bottom), respectively. *, BLA stimulation; Δ, CA1/S stimulation. The time under PSTHs shows ISIs. The PSTH in the left end at the top represents responses to subthreshold BLA stimulation, which by itself evoked no response. The second PSTH from the left end at the top and PSTH in the left end at the bottom show responses to single CA1/S stimulation. B, In each graph, filled (top, n = 16; bottom, n = 17) and open (top, n = 10; bottom, n = 13) circles represent firing probability of OMPFC neurons to CA1/S and BLA stimulation, respectively. The filled and open circles of the left end and horizontal dotted lines represent firing probability to a single CA1/S and BLA stimulation. *p < 0.05; **p < 0.01; ***p < 0.0001; compared with firing probability to single CA1/S or BLA stimulation.
