
Figure 7.
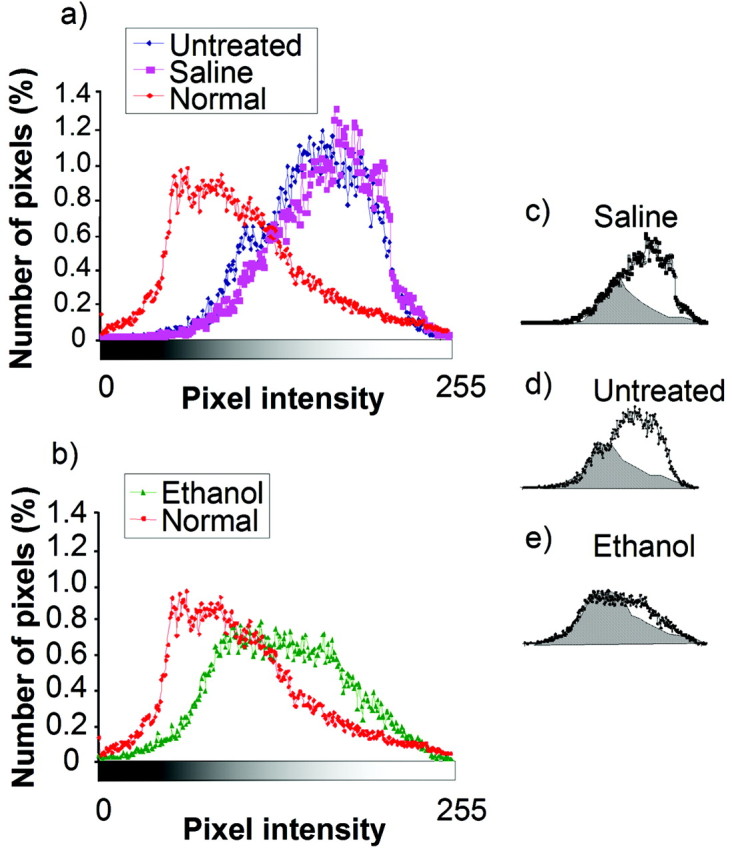
Ocular dominance profiles computed from the maps of intrinsic signal. Ocular dominance profiles were obtained by quantifying the distribution of pixels along a grayscale. Darker pixels represent response dominated by the right (contralateral) eye, whereas light pixels represent responses dominated by stimulation of the left eye. The number of pixels (percentage) is plotted as a function of position along this grayscale. After 3 d of monocular deprivation, a marked shift from normal (n = 3 ferrets) is present in the distribution of pixels from saline-treated (n = 3) and untreated (n = 3) (a) animals. A much smaller shift was present in alcohol-treated animals (n = 4) (b). To compare the differences in magnitude of these shifts, we computed the proportion of the areas under the curves for the deprived control and alcohol-treated animals that overlaps with the area under the distribution for normal animals. The overlap (dashed areas) was 45% in saline-treated animals (c), 41% in untreated animals (d), and 73% in ethanol-treated animals (e). Differences between ethanol-treated animals and the other two groups are statistically significant (χ2; p < 0.001 in both cases).