
Figure 2.
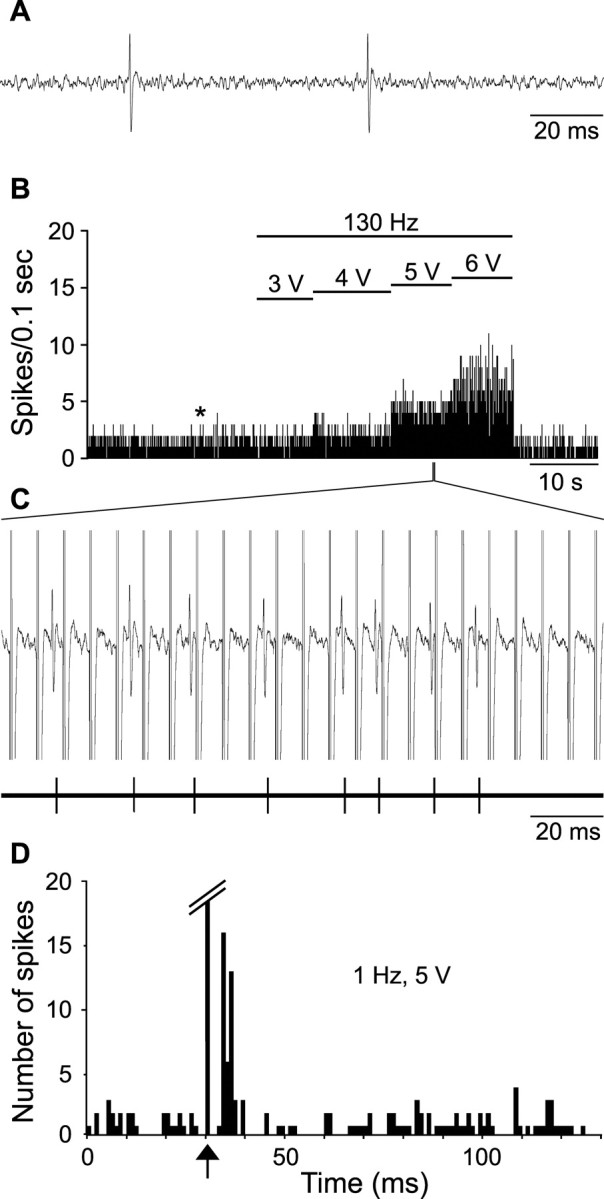
Excitatory effect of STN high-frequency stimulation on the activity of a SNR cell. A, Activity trace recorded before STN high-frequency stimulation taken at the time indicated by the star in B. B, Rate histogram illustrating the evoked increase of firing of a SNR cell during STN high-frequency stimulation (130 Hz) with increasing intensities (3, 4, 5, and 6 V); horizontal lines indicate the time of application of STN stimulation with the corresponding intensity; note that the excitatory effect is elicited only during the application of STN stimulation at high intensity. C, Magnified view of the recording (top trace) and of the event channel (bottom trace), confirming that only spikes were sampled. D, Peristimulus time histogram illustrating the excitatory response evoked in the same SNR cell by STN stimulation at 1 Hz and 5 V. Arrow indicates the time of the stimulation application.