
Figure 8.
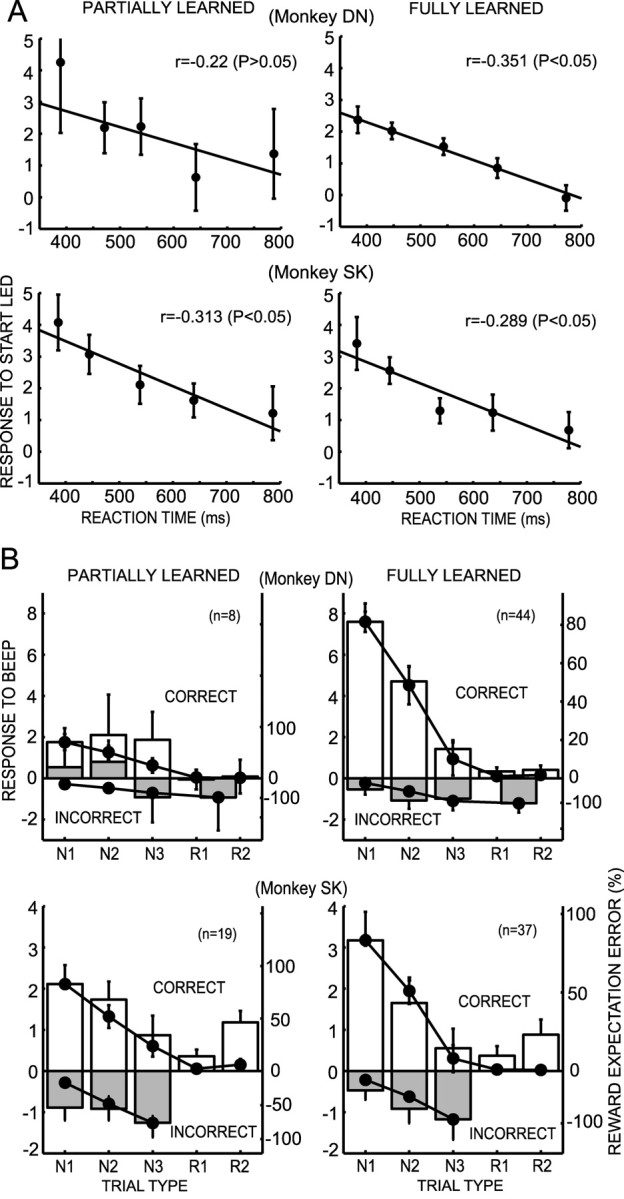
Responses of DA neurons at the early partially learned stage and the later fully learned stage. A, Scatter plot of the average responses of DA neurons (mean and SEM) and RTs to depress the start button after the CS. The plots were made for all trials independent of trial type. Trials were divided into five groups on the basis of the RTs. Regression lines are superimposed. B, Histograms of the responses of the DA neurons to the reinforcers after the animal's choices in the partially learned stage and fully learned stage in the five trial types. The values in the incorrect R1 and R2 trials are combined in monkey DN and are not plotted in monkey SK because of the very small number of trials. REEs (mean and SEM) are superimposed on the histograms. The response histograms and REEs are normalized to have the same value at the maximum REE.