Figure 4.

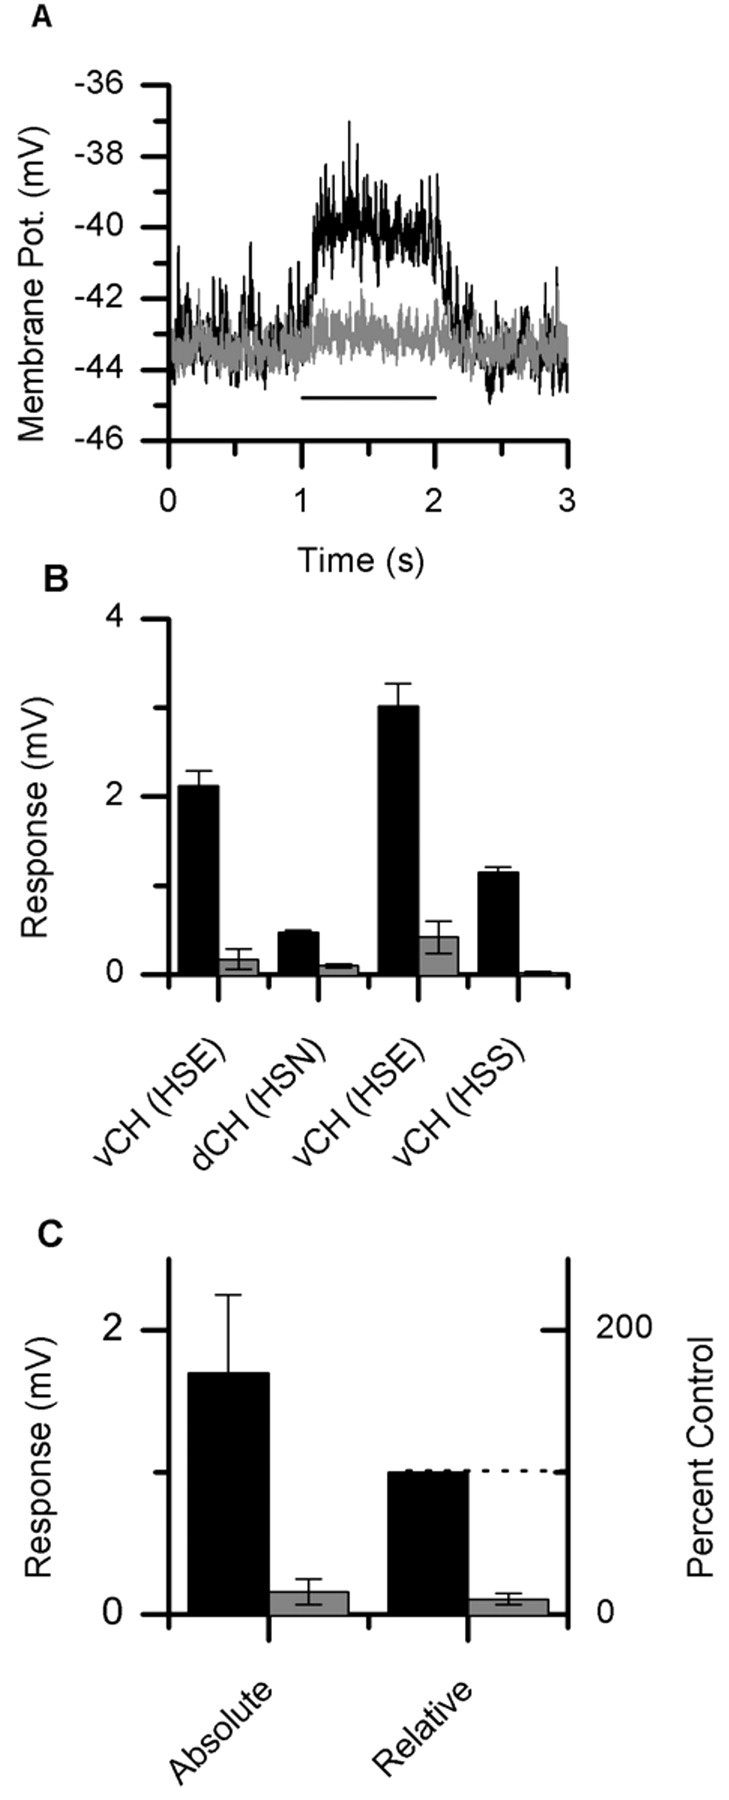
HS cell ablations. A, Average response of a vCH neuron to PD motion both before (black line) and after (gray line) the selective ablation of an HSE neuron. The bar underneath the response traces indicates the stimulus period. The response dropped from 3.01 ± 0.15 to 0.42±0.1 mV (mean±SEM). B, Average response of CH neurons before and after the selective ablation of single HS neurons. There are two examples of a vCH neuron before and after the ablation of an HSE neuron (columns 1 and 3). One example of a vCH cell before and after an HSS neuron ablation (column 4). Also shown is the average response of a dCH cell after the ablation of an HSN neuron (column 2). C, The average response of these four neurons went from 1.69 ± 0.56 to 0.17 ± 0.09 mV (mean ± SEM) after the ablation of a single HS neuron, which corresponds to a reduction of 89 ± 4%.
