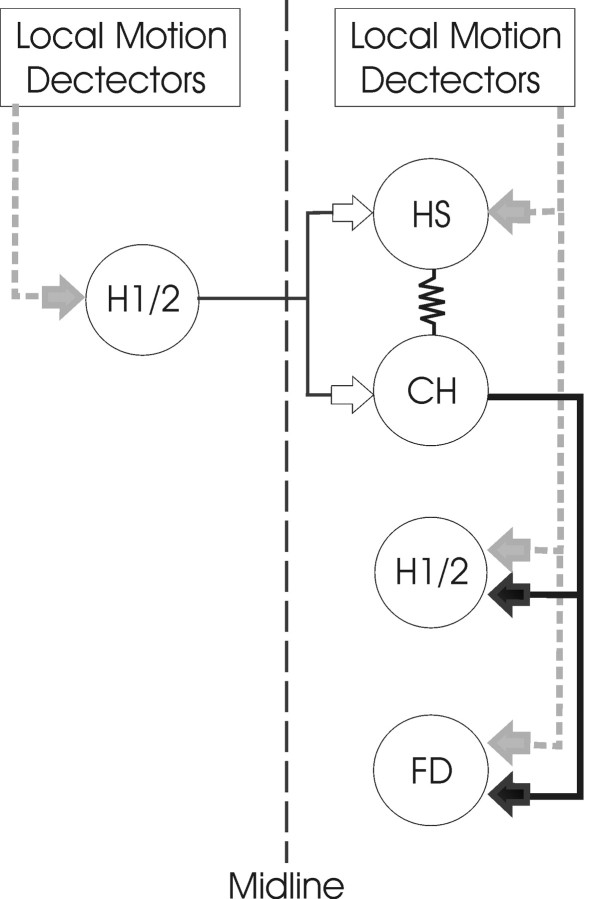
Figure 6.
Schematic diagram of the input–output pathways of HS and CH cells. An array of local motion detectors supplies HS, H1, H2, and FD cells with local motion information (gray arrows). The PD for local motion input to HS and FD cells is front to back, whereas that of H1 and H2 cells is back to front. HS and CH cells are connected electrically via their dendritic trees. CH cells inhibit H1, H2, and FD cell GABAergic synapses (black arrows). In addition, HS and CH cells receive excitatory input (white arrows) from the contralateral H1 and H2 neurons. Solid lines indicate the known connectivity, and dashed lines indicate the assumed connections. The network is symmetric about the midline. Only one-half of the network is shown for clarity.

