
Figure 1.
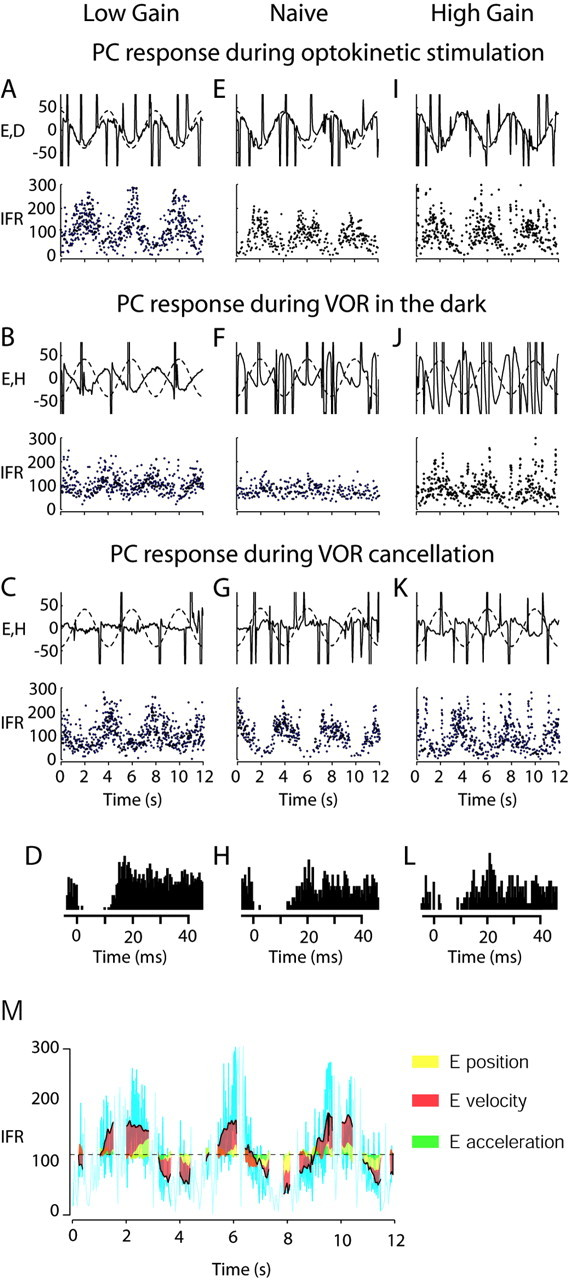
Examples of FL Purkinje cell (PC) responses during OKS (A,E,I), VORd (B,F,J), and VORc (C,G,K) before and after VOR adaptation, to show that cells change their response to VORd and the OKR after motor learning. Each panel shows: Top, solid lines, Eye velocity in degrees per second; dashed lines, the OKS velocity (first row) or head velocity (second row) or both (third row) in degrees per second; bottom, instantaneous firing rate in spikes per second. The first column (A–D) corresponds to a PC recorded after chronic low-gain adaptation in monkey 2H, the second column (E–H) corresponds to a PC recorded in the naive state in monkey 063, and the third column (I–L) corresponds to a PC recorded after chronic high-gain adaptation in monkey 2H. At the bottom of each column, we show CS and SS interaction for each of the three cells. SS responses were aligned around the occurrence of a CS at time 0 on the abscissa. Note the pause in SS activity for > 10 msec after a CS. This provides positive identification that the recorded element was a Purkinje cell. In M, we present as an example the amount of firing rate caused by any of the eye parameters during OKR for the cell presented in A. The cyan lines represent the original firing rate of the cell. In yellow, red, and green, we show the amount of firing rate contributed by the eye position, velocity, and acceleration components. The dashed line indicates the DC firing rate in light. The portions of the data that correspond to a saccade are indicated by a lighter cyan line (these portions corresponding to saccades are not used for analysis).