
Figure 2.
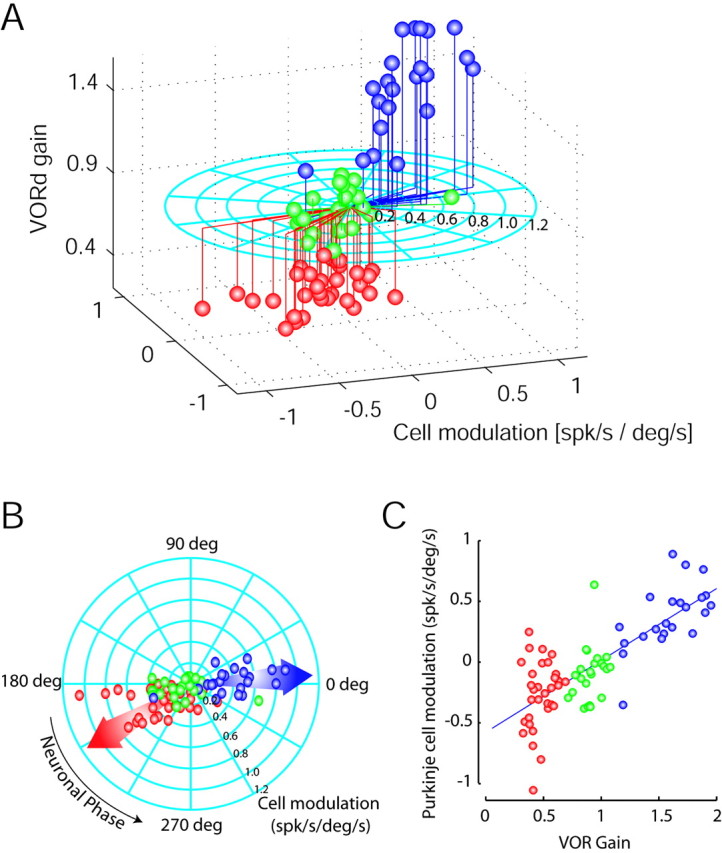
Polar plots representing differential Purkinje cell responses during VORd in low-, normal-, and high-gain-adapted animals. A, Three-dimensional representation in which the modulation amplitude for each cell is indicated as the length of the line running on the flat circle, and the phase of the modulation is indicated by the angle of that line. Zero degrees indicates modulation in phase with upward head movement, and 180° is modulation out of phase with upward head movement (modulation increases with downward head movement). The gain of the reflex is plotted on the ordinate. B and C decompose the three-dimensional plot into two-dimensional plots. B is a top view of the graph in A. Arrows indicate the average phase for the high-gain (blue arrow) and low-gain (red arrow) populations. C, The Purkinje cell modulation versus VORd gain in a Cartesian plot. The x-axis represents VOR gain, whereas the y-axis represents the normalized PC modulation (cosine function of the neuronal phase multiplied by the total modulation). Cells recorded in the low-, normal-, and high-gain animal are plotted as red, green, and blue spheres, respectively.