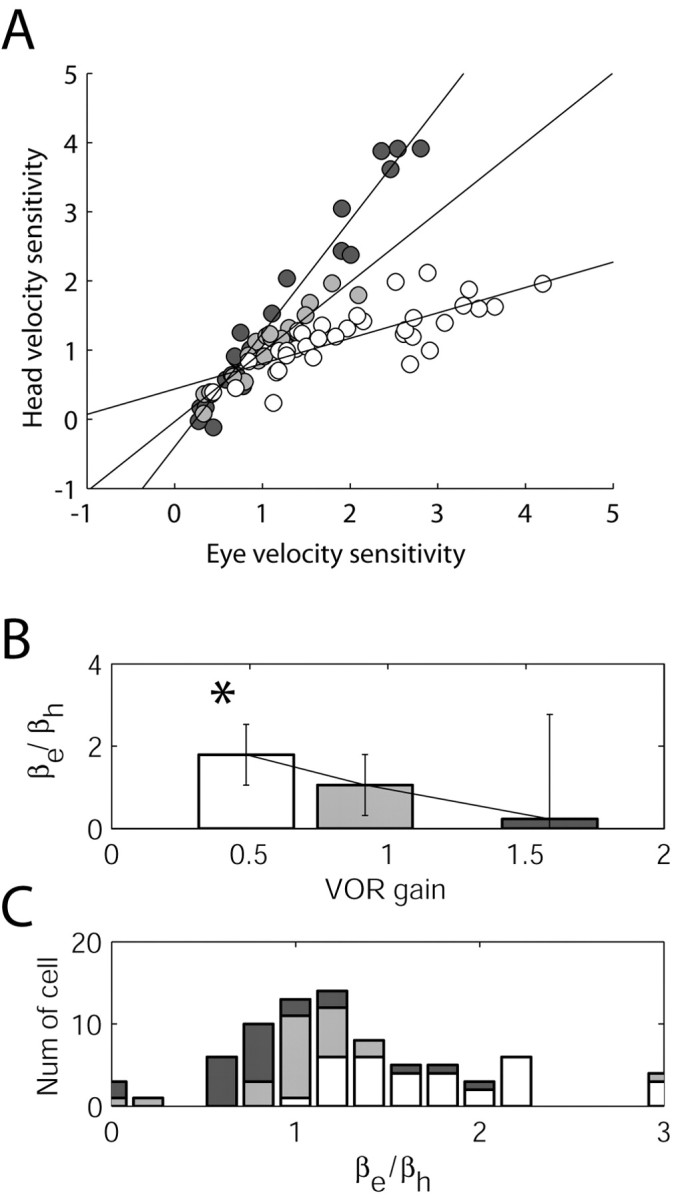
Figure 4.

Normalized plots of head velocity sensitivity in Purkinje cells with respect to eye velocity sensitivity. This form of normalization could mistakenly be interpreted as monotonic changes in head velocity. In all panels, Purkinje cells were separated into groups corresponding to the low-gain (white), normal-gain (gray) and high-gain (black)-adapted animals. A, Data from individual cells in which head velocity sensitivity was normalized with respect to eye velocity sensitivity (from Fig. 3A,B). The lines represent the result of linear fitting of the data. In B, βe/βh is plotted as the average and SD for the low, normal, and high populations. Note the monotonic change in the ratio of these parameters with VORd gain. In C, a density histogram is plotted as stacked bars graphically showing the most common values for each subpopulation (low, normal, and high).
