
Figure 5.
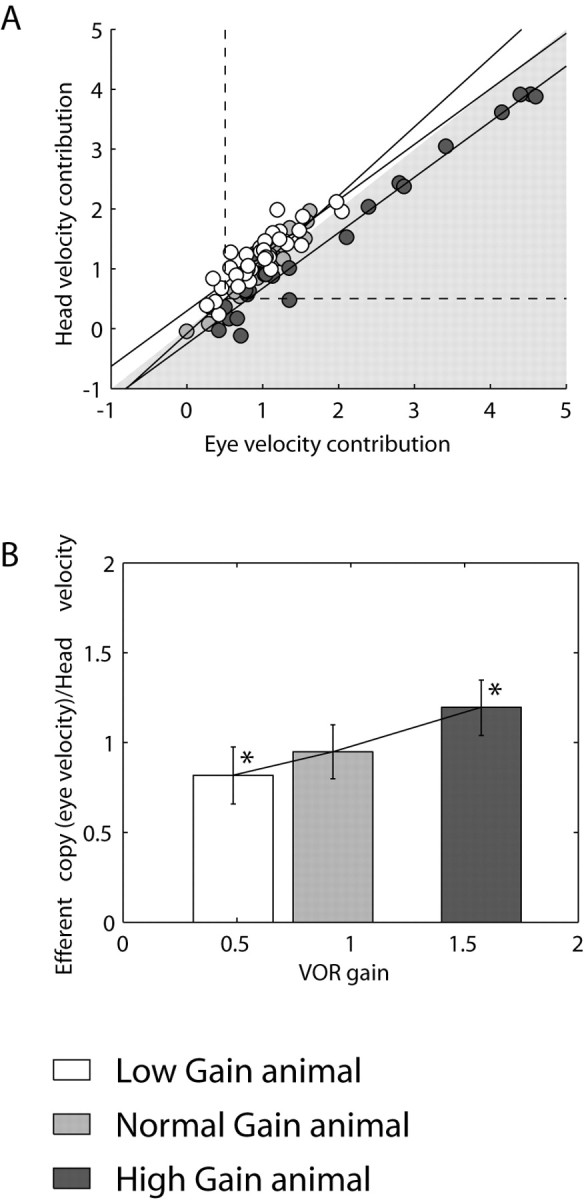
Normalized plot of head velocity input in Purkinje cells with respect to eye velocity input indicates lower head velocity contribution to Purkinje cell firing after high-gain adaptation. As in Figure 4, Purkinje cells were separated into three groups corresponding to the low-gain (white), normal-gain (gray), and high-gain (black)-adapted animals. A, The same data presented in Figure 3A are normalized versus the eye velocity contribution (eye velocity sensitivity × VOR gain) during the three VOR gain states. The shaded area divides the graph into a zone dominated by eye velocity contribution (inside the shaded area) and a zone dominated by head velocity contribution (outside the shaded area). High-gain data are preferentially dominated by the eye component whereas low-gain data are dominated by the head component. The dotted lines delineate values of eye or head velocity contribution larger or smaller than 0.5. B, Bar plot representing the average ± SD from the data in A above and to the right of the dotted lines (see Results for additional explanation). Asterisks indicate the statistical significance between the high- or low-gain Purkinje cell population.