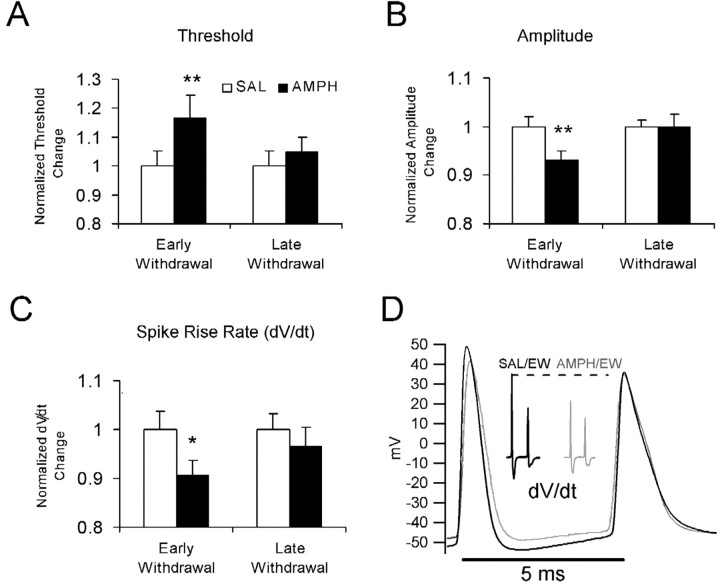
Figure 2.
Amphetamine-induced changes in action potential properties. A–C show the significant differences between early withdrawal from repeated SAL or AMPH (gray) on the normalized (x/average SAL control) change in initial spike threshold (threshold-holding potential) (A) (**p < 0.01) and normalized height (B) (**p < 0.01) and rise rate (C) (*p < 0.05). Cells in all treatment groups were held at similar holding potentials before triggering action potentials (SAL/EW = –67.3 ± 0.3; AMPH/EW = –67.6 ± 0.3; SAL/LW = –67.7 ± 0.2; AMPH/LW =–68.0 ± 0.03). All groups were composed of 16–19 cells. D, Threshold burst in response to a 600 msec step current pulse injection in representative SAL/EW (black) and AMPH/EW (gray) BS neurons. The AMPH/EW trace has an elevated initial spike threshold, decreased amplitude, and decreased rise rate (dV/dt, inset), as also seen in A–C and in Table 1. The inset shows the spike rise rate calculated as the first derivative of the bursts for each group shown in A (dV/dt: SAL/EW = 605 mV/msec; AMPH/EW = 408 mV/msec). There were no differences between the two BS cells on the holding potential before the burst was triggered (SAL/EW =–68.0 mV; AMPH/EW =–67.5 mV).

