
Figure 1.
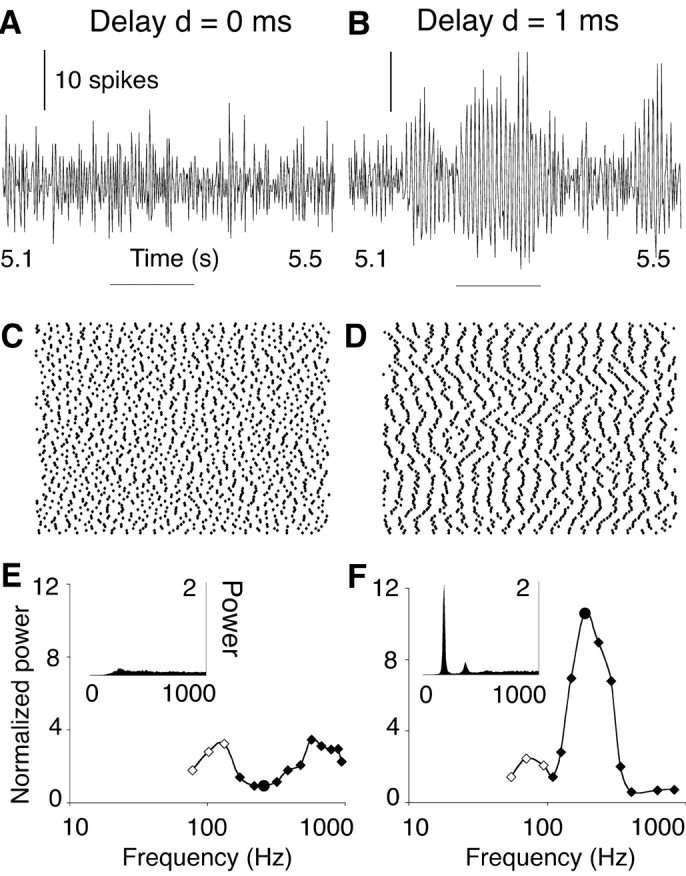
Resonance in a delayed inhibitory network. The activity of a one-dimensional, nearest neighbor-coupled network of 100 neurons is illustrated for two delay values of the synaptic response: d = 0 msec (A, C, E) and d = 1 msec (B, D, F). The synaptic decay time constant τ was 3 msec. A, B, Time histograms of the number of spikes generated by the entire population of neurons (bin width, 0.5 msec). Horizontal bars indicates zero level. C, D, Raster plots of spikes fired during the time interval indicated by the horizontal bars in A and B. Each dot represents a spike (x-axis, time; y-axis, position of the neuron along the array). In the network with d = 1 msec (D; CI = 0.110), most neurons fired at each oscillation cycle; hence, the network frequency (187 Hz) was close to the mean neuronal firing rate (181 ± 10 spikes/sec). In the network with zero delay (C; CI = 0.087), spikes were produced at a similar rate (172 ± 16 spikes/sec), but their spatiotemporal patterning was lost. E, F, Insets show periodograms [units 1 (0.5 msec)2] of the spike count histograms shown in A and B averaged over 7 sec. Tuning curves plot peak power and network frequency obtained at various levels of network excitation (filled circle in each tuning curve: data from A, B). In the simulations represented by open points, adjacent neurons fired in antisynchrony (van Vreeswijk et al., 1994); hence, network frequency was twice the mean neuronal firing frequency.