
Figure 8.
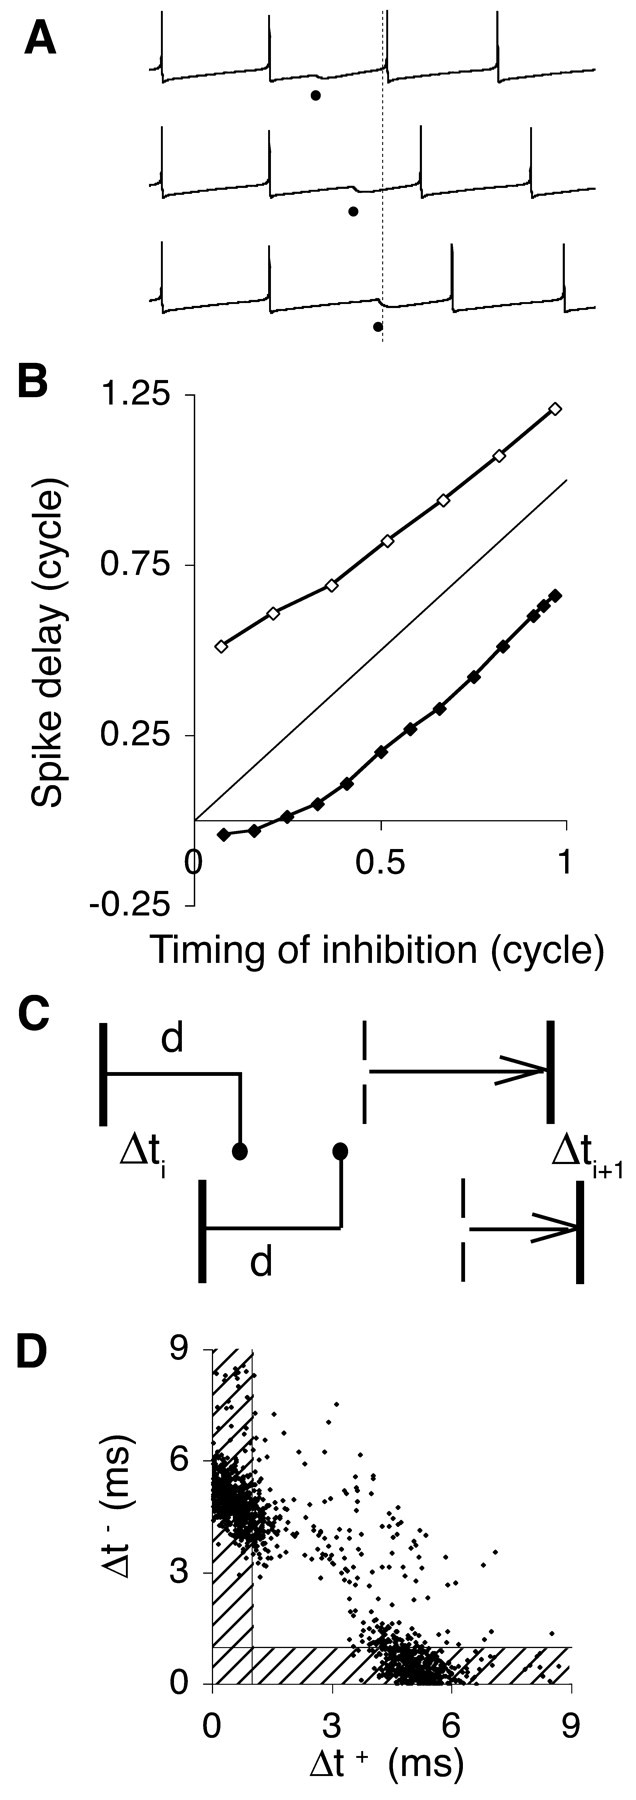
Mechanism of synchronization and frequency tuning. A, Activation of an inhibitory synapse resets the firing cycle of the model neuron. The synapse is activated after 15 (top membrane potential trace), 27 (middle trace), and 35 (bottom trace) msec in a 36 msec firing cycle. Dots indicate times of synaptic activation, and the vertical dashed line indicates the end of the cycle in the absence of inhibition. B, Phase-response curve, plotting the delay in spike generation after the activation of an inhibitory synapse at varying time instants (Rinzel and Ermentrout, 1999). The x- and y-axis variables are expressed as fractions of the duration of the firing cycle. The strength of the activated synapse was 1 or 3 mS/cm2 (filled, open symbols, respectively). A phase-resetting curve parallel to the diagonal line corresponds to a fixed delay elapsing between the activation of the inhibitory synapse and the generation of the next spike. C, Heuristic diagram of the synchronization mechanism. In one cycle, the interval between a pair of spikes from mutually inhibitory neurons (vertical bars) decreases from Δti < d to Δti + 1 (see Results). The broken vertical bars represent the expected spike times in the absence of inhibition. D, Relative timing of spikes from two adjacent neurons in the simulated network of Figure 1(d = 1 msec). Each spike of the reference neuron is represented as a dot, positioned according to the absolute time interval made with the previous (Δt+; x-axis) and next (Δt-; y-axis) spikes of a neighbor neuron. Most spikes led or lagged the neighbor neuron by an interval less than the delay d of the synaptic response (shaded areas).