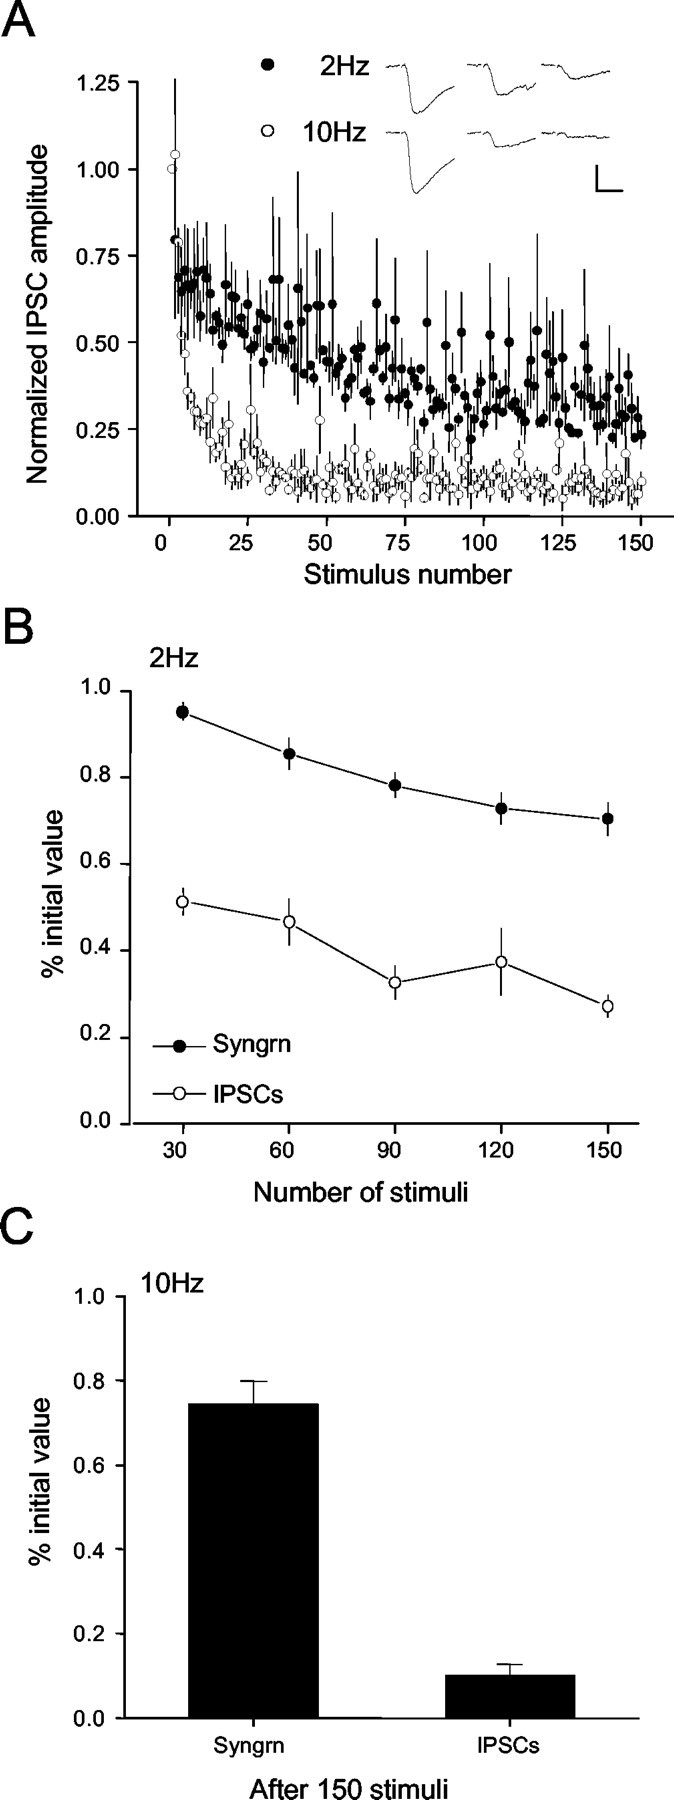
Figure 4.

Comparison of repetitive stimulation on dye release and monosynaptic evoked IPSCs at 2 and 10 Hz. A, Decrease in IPSC amplitudes (from 3 cells, 3 slices) caused by 150 stimuli delivered at 2 Hz (•) or 10 Hz (○). Inset, Representative IPSCs, means of 3 each, at the indicated times. Calibration: 200 pA, 25 msec. B, Comparison of the destaining of Synaptogreen-loaded boutons (•) and the depression of IPSCs (○) during 2 Hz stimulation. Fluorescence measurements were made after the indicated number of stimuli. For IPSC depression, the last two IPSCs in the indicated period were averaged (see Results). C, Comparison of the destaining of Synaptogreen-loaded boutons and IPSC depression after 15 sec of 10 Hz stimulation.
