
Figure 6.
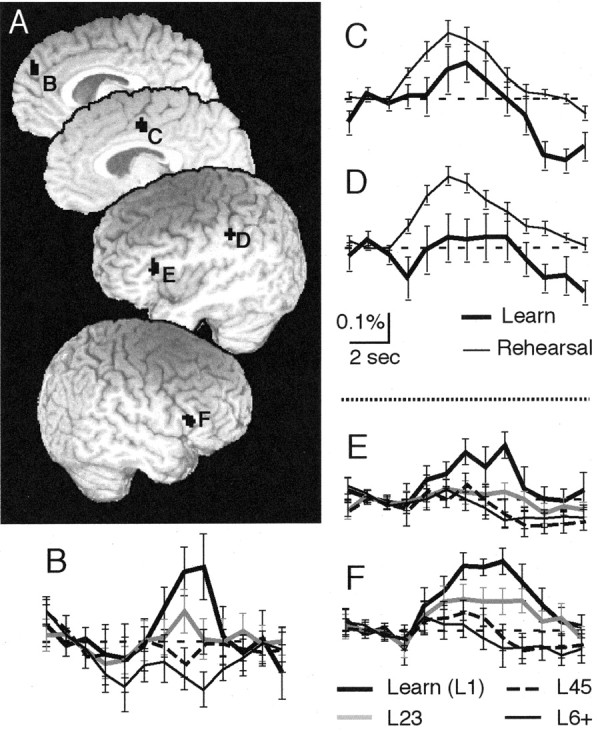
Brain activation for the first correct association trial compared with rehearsal. A, Activation clusters occurred in the right medial SFG (B), the left cingulate gyrus (C), left IPL (D), and left and right IFG (E, F). Clusters B, E, and F showed a statistically significant linear decrement in activation from the first through subsequent correct trials. These same clusters also showed a statistically significant difference in activation between the first and subsequent correct trials (compare regression coordinates below with ANOVA results shown in Table 1). The activation time courses are shown in B, E, and F. B-F, Time courses for right medial SFG (B; significant from 7-8 sec; X = -3, Y = -48, Z = 30; 12 voxels), the left cingulate (C), the left superior parietal lobule (D), left IFG (E; significant at 8 sec; X = 40, Y = -21, Z = 17; 26 voxels), and the right IFG (F; significant from 7-9 sec; X = -51, Y = -18, Z = 19; 18 voxels). Other coordinates and times of significant activation are shown in Table 1.