
Figure 5.
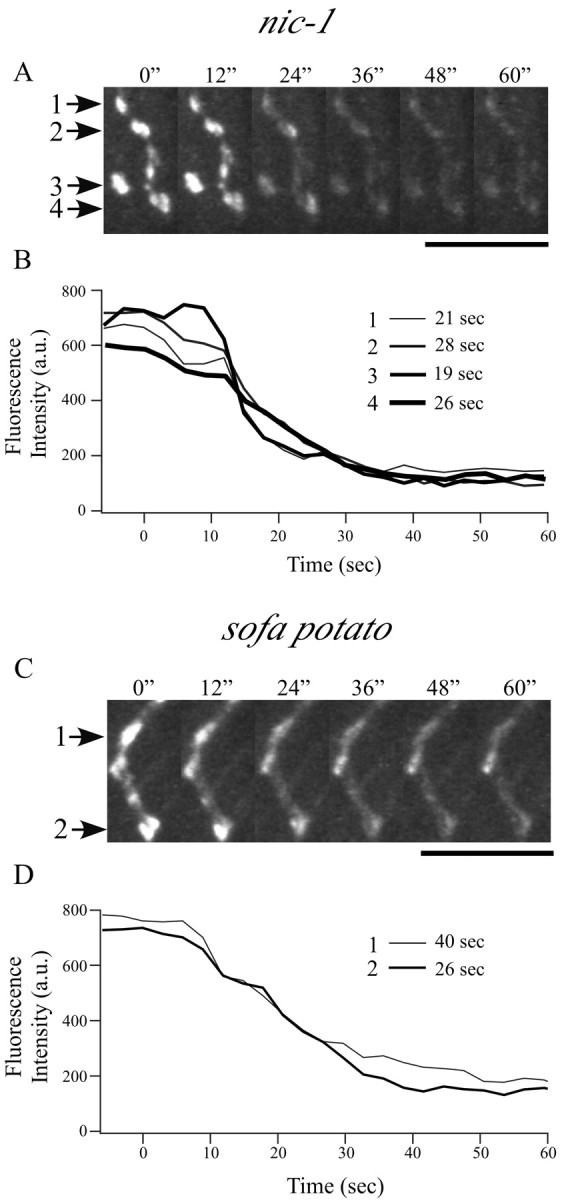
High-potassium destaining kinetics of FM1-43-loaded varicosities in mutant zebrafish. Representative time-lapse images of labeled varicosities (indicated by arrows) are shown at 12 sec intervals for nic-1 (A) and sofa potato (C) after perfusion of high-potassium solution. Scale bars, 10 μm. The associated time course of fluorescence loss for each varicosity is plotted in B and D for each mutant after background correction. Time 0 is determined by the slight twitch of muscles with arrival of high-potassium solution. Fluorescence intensity was measured every 3 sec. The time required for decay from 90 to 10% of peak fluorescence determined for each trace is indicated alongside the corresponding legend bar.