
Figure 2.
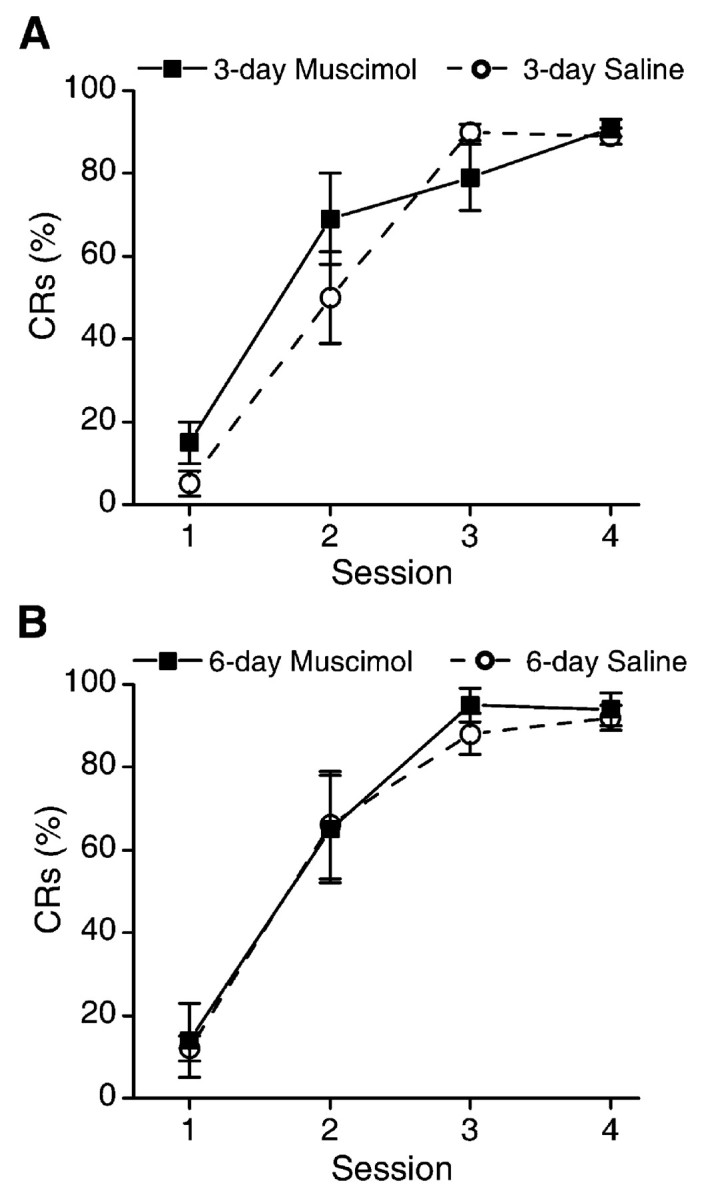
A, Mean ± SEM percentage of CRs for the 3-day muscimol and 3-day saline groups over the four acquisition sessions of phase 1. There were no differences between groups. B, Mean ± SEM percentage of CRs for the 6-day muscimol and 6-day saline groups over the four acquisition sessions of phase 1. There were no differences between groups.