
Figure 1.
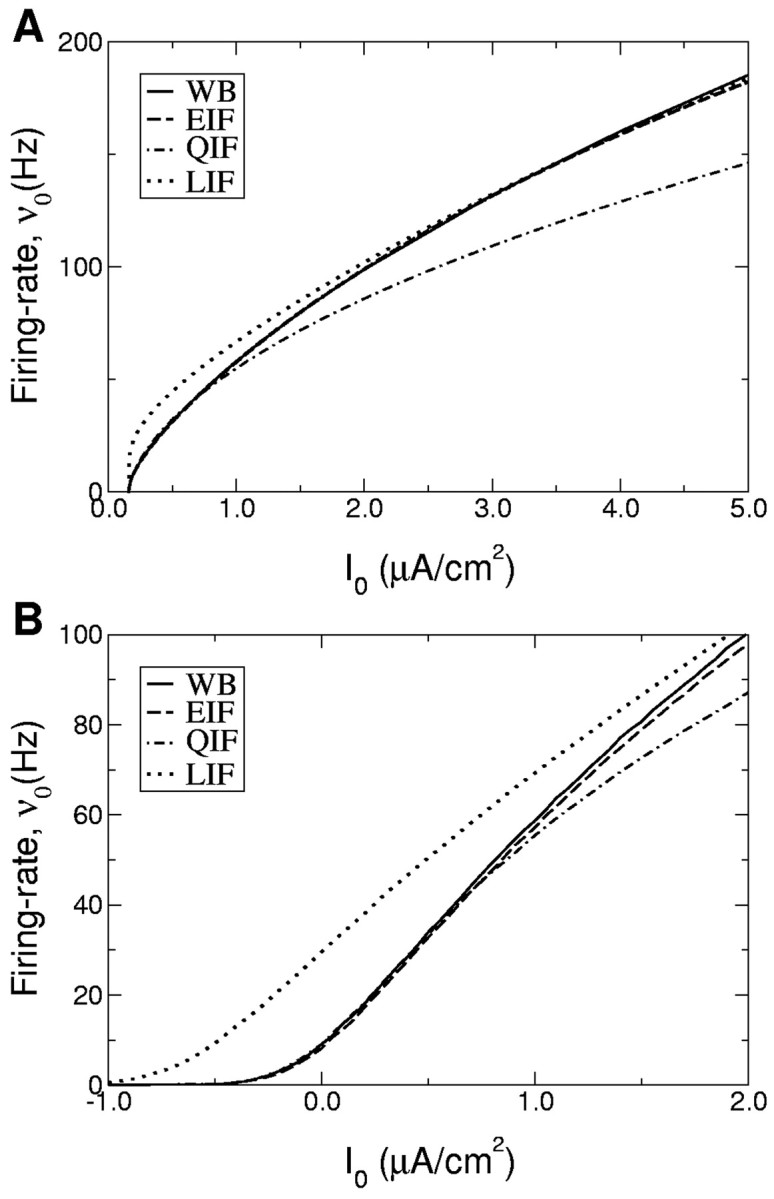
A, B, f-I curves of the LIF, QIF, EIF, and WB neurons for a constant input current (A) and a noisy input current (B) (Gaussian white noise, σ = 5 mV). The parameters of the EIF model were chosen to match the f-I curve of the WB model. The parameters of the QIF model were chosen to match the behavior of the f-I curve of the WB model near firing onset. The range of firing rates in which the f-I curves of the QIF and WB models match is more restricted than for the EIF model. The f-I curve of the LIF neuron cannot be made to agree with the f-I curves of the other models at low firing rates because of the different qualitative dependence of the firing rate on the input current (logarithmic vs square-root). In contrast, the parameters of the LIF model can be determined to match the f-I curve of the WB model at high frequencies (see Materials and Methods for details on the determination of the model parameters).