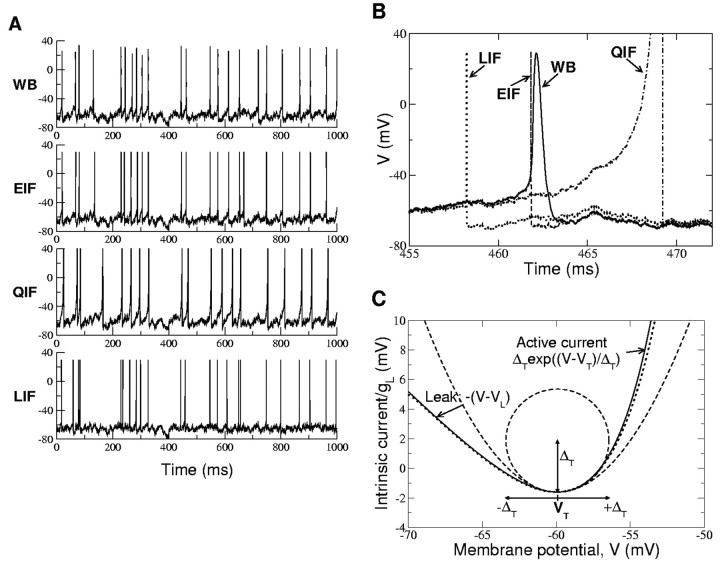
Figure 3.
A, Voltage traces for WB, EIF, QIF, and LIF neurons for the same realization of the noisy input current. B shows a higher resolution for a short time interval in which a spike has been generated in all models. The subthreshold traces are similar for all models; however, the dynamics of the spike are different on an msec time scale. When the fluctuation leads to a spike in all models, the LIF neuron spikes first. The EIF neuron spikes almost exactly at the spike onset of the WB. The QIF neuron fires much later. For details of the QIF and EIF parameters, see Materials and Methods. For the WB parameters, see Appendix A. Here, the LIF model has the leak current of the WB model, a reset potential of Vr = - 68 mV, and Vth = - 57 mV, to get the same average firing rate as the WB model. C, I-V curve of the EIF (solid line) and WB (dotted line) neurons. The threshold VT is defined as the minimum of the curve. The spike slope factor ΔT is proportional to the radius of the curvature of the I-V curve at its minimum.

