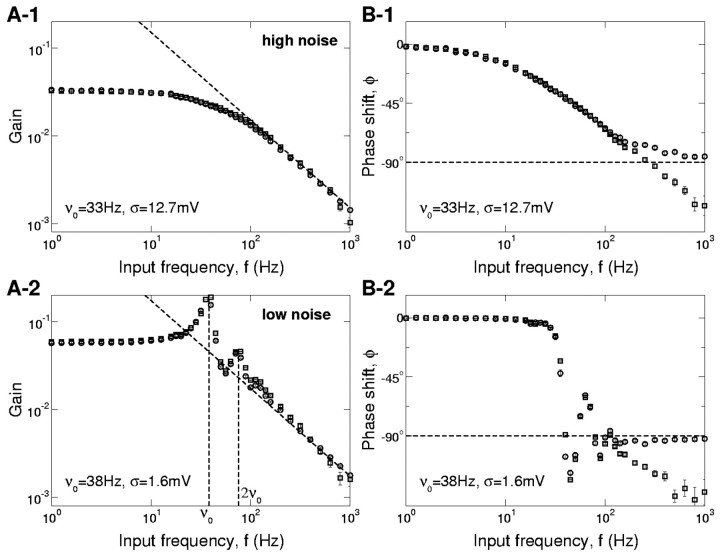
Figure 9.
Comparison of the filters of the WB model (□) and the EIF model (○). We plot the gain (A, 1-2) and phase shift (B, 1-2) with high (A-1, B-1) and low noise (A-2, B-2). Note the good agreement in all regimes for the gain. The phase shifts of both models are very similar up to an input frequency at ∼100 Hz in which the WB model has an additional phase lag. This is a consequence of the fixed delay between EIF and WB spike time shown in Figure 3B.

