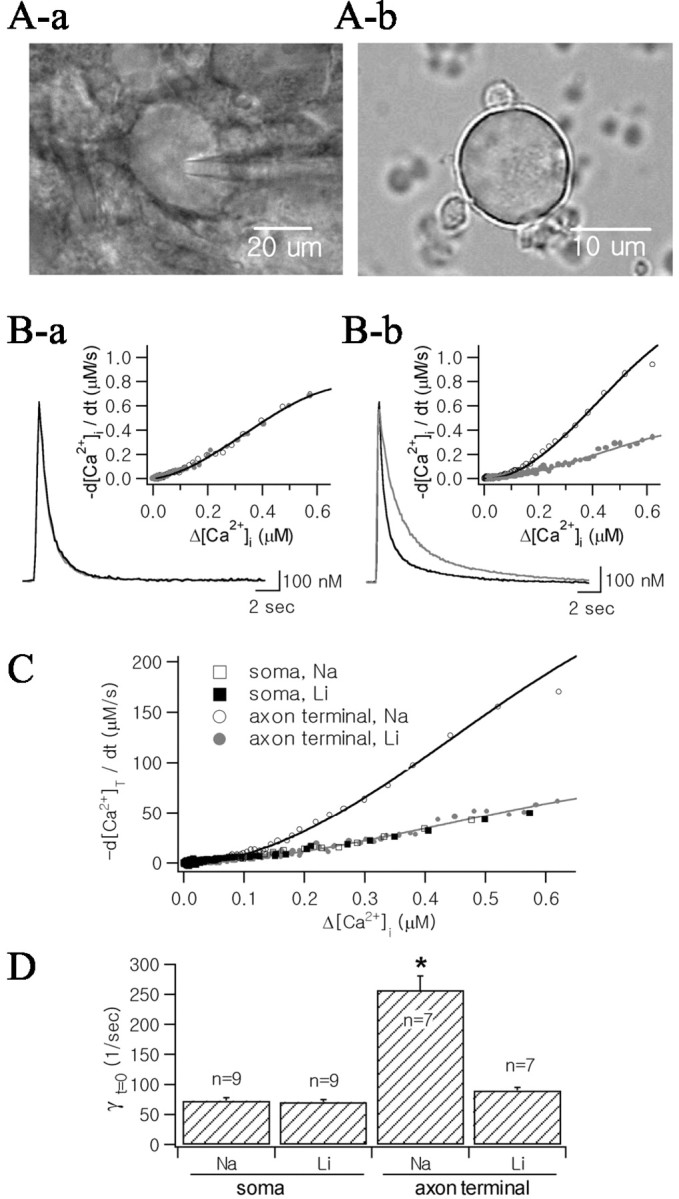
Figure 2.

Effects of external Na+ reduction (replaced with Li+) on Ca2+ transients of somata and axon terminals. A, Micrograph of the MNC soma in supraoptic nucleus (Aa) and that of axon terminals dissociated from neurohypophysis (Ab). Ba, Two Ca2+ transients from the soma were superimposed in control condition (black line) and after the 10 min superfusion with low Na+ aCSF (24 mm, gray line). K+ pipette solution containing 50 μm fura-2 was used for the internal solution. Ca2+ transients were evoked by depolarizing pulses (from -60 to 0 mV; 300 msec duration). Bb, Two Ca2+ transients recorded in the axon terminal (black line: control; gray line: low Na+ condition). The same internal solution was used as Ba. Ca2+ transients were evoked by 200 msec depolarization. Insets, Time derivatives of decay phases of Ca2+ transients (-d[Ca2+]i/dt) were plotted as a function of Δ[Ca2+]i, and fitted with fourth-order polynomial equations (open circles and black lines: control condition, filled circles and gray lines: low Na+ condition). C, Time derivatives of total Ca2+ (d[Ca2+]T/dt) decay as a function of Δ[Ca2+], which were obtained from Ca2+ transients illustrated in B. Four plots obtained from the soma (rectangles) and the axon terminal (circles) were superimposed. Values for d[Ca2+]T/dt were calculated according to Equation 6, assuming that κS values for soma and axon terminal are 79 and 187, respectively, and that KD of fura-2 is 201 nm. Plots of -d[Ca2+]T/dt were fitted with fourth-order polynomial equations. D, Mean values for instantaneous Ca2+ clearance rate constants (γt=0) calculated using Equation 14 before (indicated by “Na”) and after extracellular Na+ reduction (indicated by “Li”). Asterisk indicates statistical significance (p < 0.01).
