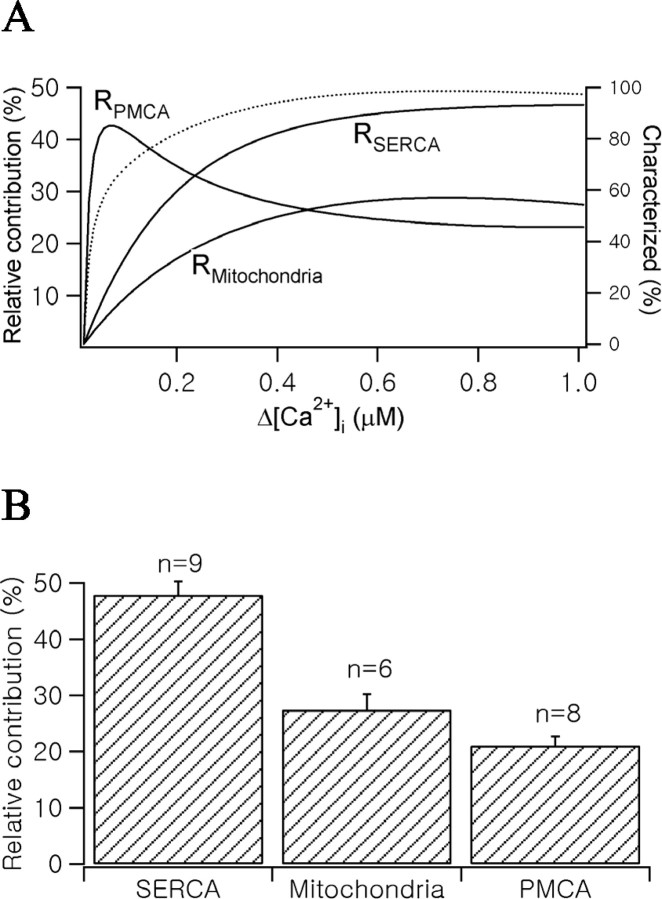
Figure 5.
Relative contribution of Ca2+ clearance mechanisms in MNCs somata. A, RSERCA, RMitochondria, and RPMCA shown in Figure 4 Ab, Bb, and Cb were summarized (left ordinate). RPMCA was corrected for the condition in the absence of CPA. The dotted line represents a characterized fraction of total Ca2+ clearance rate (right ordinate). B, The bar graph represents relative contribution of each Ca2+ clearance mechanism calculated from γt = 0 values.

