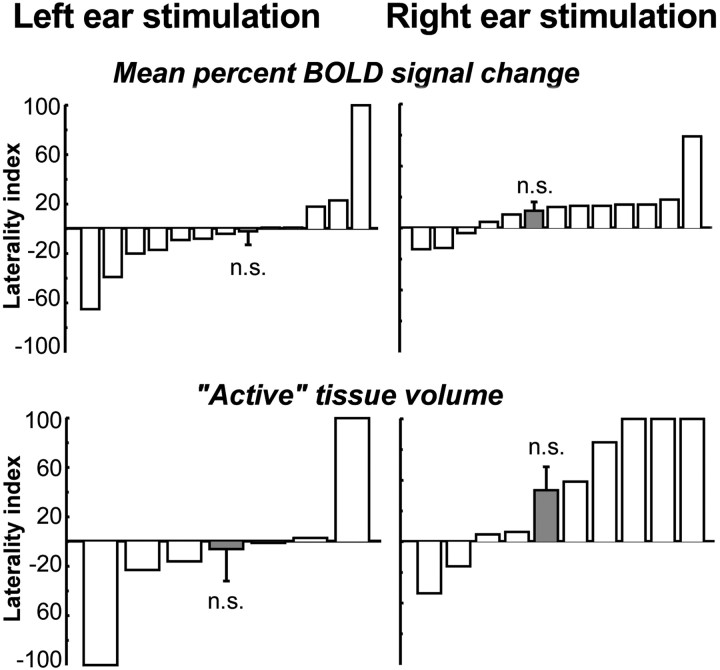
Figure 4.
LI for individuals (white) and the group mean ± SEM (gray) for the MGN. Monaurally presented tones did not produce a clear pattern of lateralization. When responses were based on mean percentage BOLD signal change (top row), there was no significant difference between ipsilateral and contralateral responses. The same was true when responses were based on the volume of active tissue, but note that only a subset of participants had any active voxels in either the left or right ROI at Z > 3.5.

