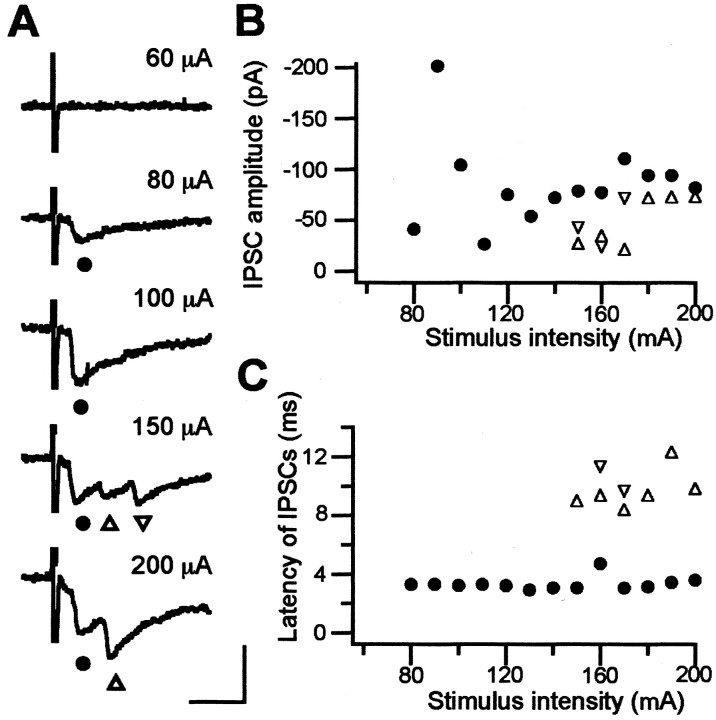
Figure 3.
Striatal stimulation induced short- and long-latency IPSCs in GP neurons. A, Sample traces of IPSCs to striatal stimulation with various stimulus intensities. This cell is from the WT littermate of a D4KO mouse. Filled circles indicate initial IPSCs; triangles indicate second and third IPSCs. Calibration: 10 msec, 100 pA. B, Plot of the IPSC amplitude against the stimulus intensity. Initial large IPSCs (filled circles) started to appear at a stimulus intensity of 80 μA; second and third IPSCs (triangles) appeared at 150 μA and were smaller. C, Plot of IPSC latency against stimulus intensity. The latency of initial IPSCs was 3.3 ± 0.1 msec, and that of the second and third IPSCs was 10.5 ± 0.7 msec.

