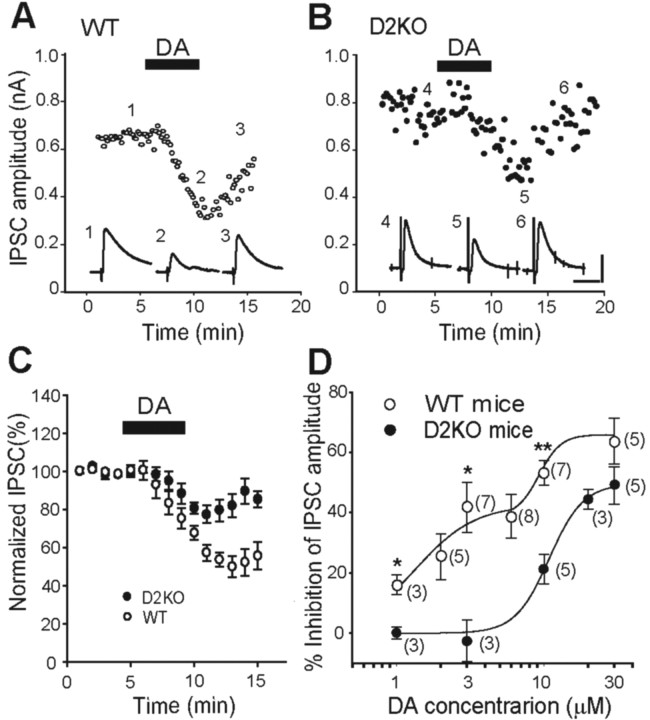
Figure 4.
Effects of DA on IPSCs. A, B, Effects of DA (10 μm; filled bars) on IPSCs recorded from WT (A) and D2KO (B) mice. Insets, Traces taken at indicated time points in A and B are representative IPSCs from acute slices from WT (1-3) and D2KO (4-6) mice before, during, and after the application of DA, respectively. Calibration: 0.4 nA, 20 msec. C, Normalized IPSC amplitudes were monitored before, during, and after the application of DA (10 μm) for the period indicated by the filled bar in acute slices from WT (open circles; n = 7) and D2KO (filled circles; n = 5) mice. D, Concentration-response relationships for DA-induced inhibition of IPSCs recorded from WT (open circles) and D2KO (filled circles) mice. The numbers of experiments are shown in parentheses. *p < 0.05; **p < 0.01; unpaired Student's t test.

